Figures & data
Table 1. The grain sizes of the 500°C-annealed MZxNO films
Figure 1. GIXRD patterns of MZxNO thin films
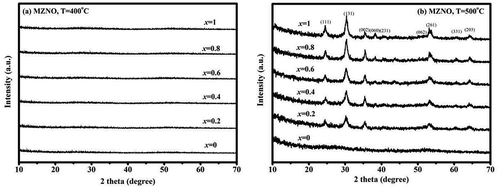
Figure 2. FESEM of the MZxNO samples annealed at (a) 400°C and (b) 500°C
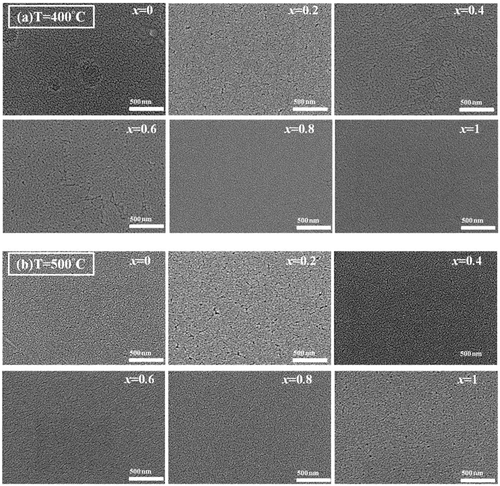
Figure 3. J-E relations of the Al/MZxNO/ITO/glass MIM capacitors annealed at (a) 400 and (b) 500°C
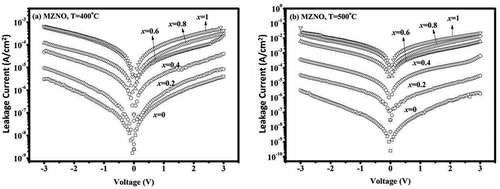
Table 2. The area ratio of the XPS peaks of the 400°C-annealed MZxNO films
Figure 4. XPS core spectra of the (a) Mg 2p, (b) Zn 2p, (c) O 1s and (d) Nb 3d signals of the400°C-annealedMZxNO films
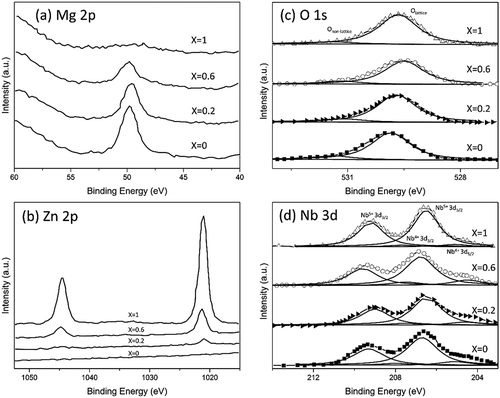
Figure 5. (a) Transmittance spectra and (b) bandgap plot of the MZxNO/quartz
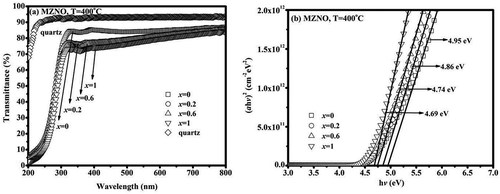
Figure 6. (a) C-V and(b) tanδ-V relations of the Al/MZxNO/ITO/glass MIM capacitors annealed at 400°C
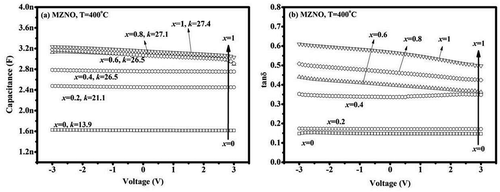
Figure 7. (a)C-f and(b) tanδ-f relations of the Al/MZxNO/ITO/glass MIM capacitors annealed at 400°C
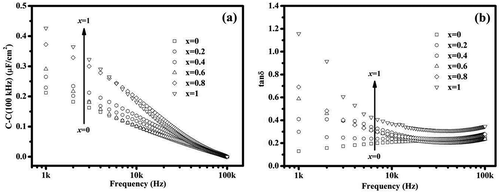
Figure 8. SE and PFE plots of the Al/MZxNO/ITO/glass MIM capacitors annealed at 400°C
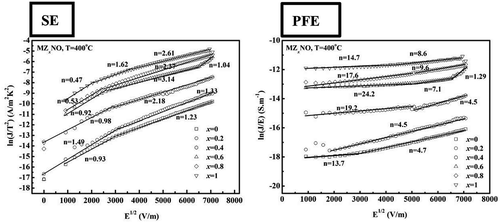
Figure 9. The double logarithmic I–V relations of the Al/MZxNO/ITO/glass MIM capacitors annealed at 400°C
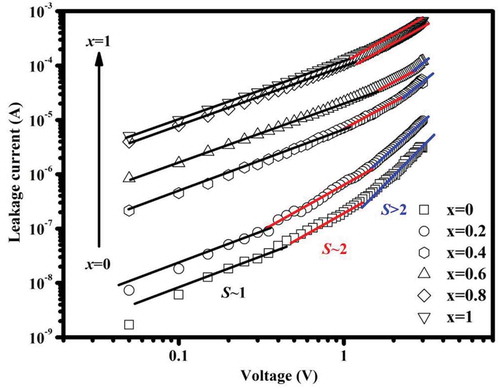
Figure 10. The ln(J/E2)-1/E relations of the Al/MZxNO/ITO/glass MIM capacitors annealed at 400°C
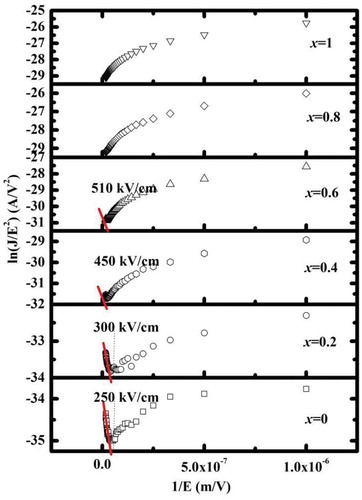
Table 3. Summary of the conduction mechanisms of MZxNO samples
Table 4. The calculated values of the band diagram and EFN of the MZxNO samples
Figure 11. The valence band spectra of the 400°C-annealed MZxNO samples
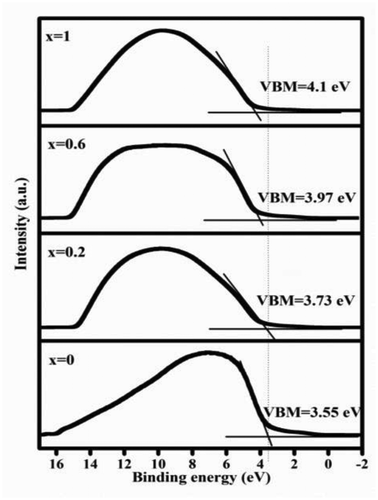
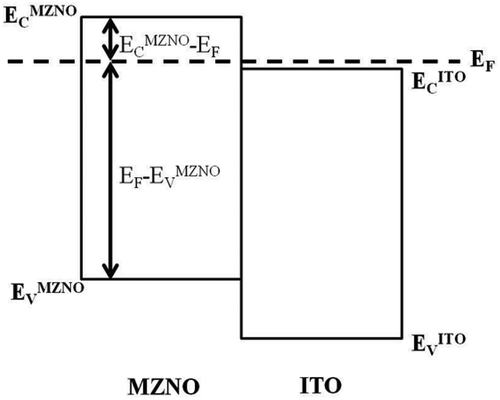
Figure 12. The energy band diagram of the MZNO/ITO heterostructure