Figures & data
Table 1. Compositions and sample names
Figure 1. Schematic diagram showing the cylindrical graphite mold for the pressureless SPS
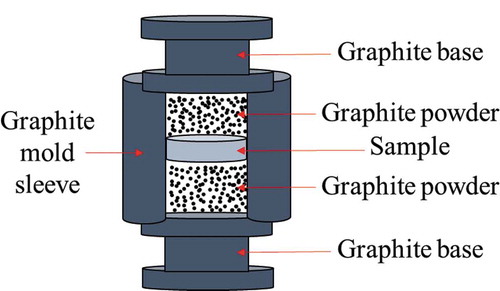
Figure 2. XRD patterns for (a) the mixed powder and the 1-SNT5 sample with 5.0 wt.% TiC0.3N0.7 after pressureless SPS at different temperatures 1500–1650 °C and (b) the 1-SNT0, 1-SNT2, 1-SNT5 and 1-SNT7.5 samples with 0, 2.0, 5.0 and 7.5 wt.% TiC0.3N0.7, respectively, after pressureless SPS at 1550 °C
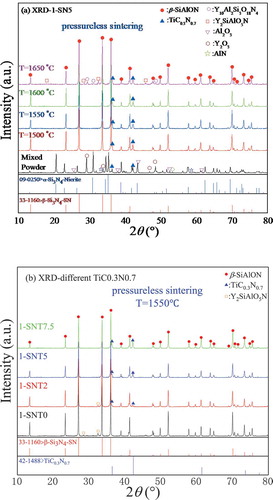
Figure 3. Typical back scattering electron micrographs on the polished surfaces of the representative 1-SNT5 sample with 5.0 wt.% TiC0.3N0.7 after pressureless SPS at different temperatures, consists of the dark gray phase region, the bright white phase region and the white phase region
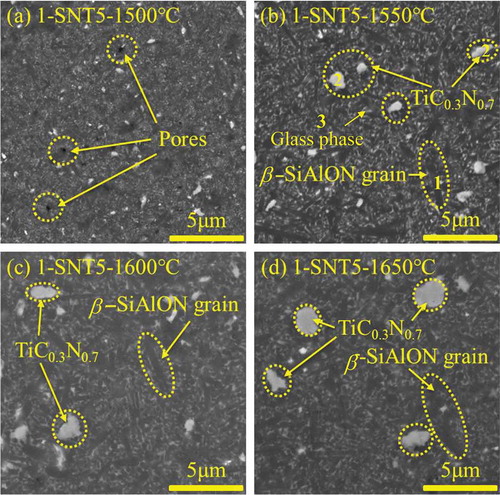
Figure 4. EDS results for (a) the elongated dark gray region (β -SiAlON phase), (b) the bright region (TiC0.3N0.7 phase) and (c) the white region (glass phase) in the micrograph on the polished surface of the 1-SNT5 sample with 5.0 wt.% TiC0.3N0.7 after pressureless SPS at 1550°C (see )
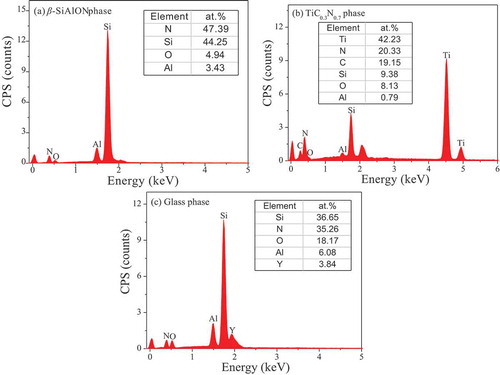
Figure 5. Microstructures (a) and elemental mapping of Si (b), Al (c), O (d), Ti (e), N (f), C (g) and Y (f) on the polished surface of the 1-SNT5 sample with 5.0 wt.% TiC0.3N0.7 after the pressureless SPS at 1550°C
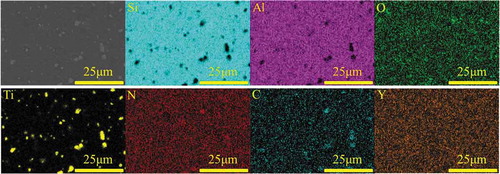
Figure 6. (a) Density (ρ), (b) hardness (HV) and (c) fracture toughness (K1C) of the samples after both pressureless SPS and further pressurized SPS at different temperatures (T)
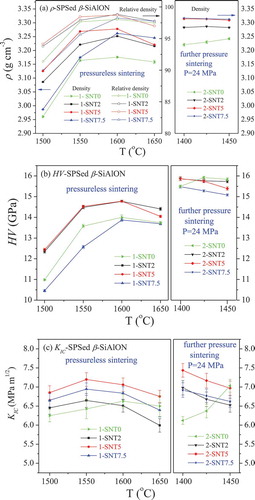
Figure 7. Back scattering electron micrographs for the typical Vickers fingerprint (a) and crack propagation observations (b-i) near the indentation at the polished surfaces of the 1-SNT5 sample
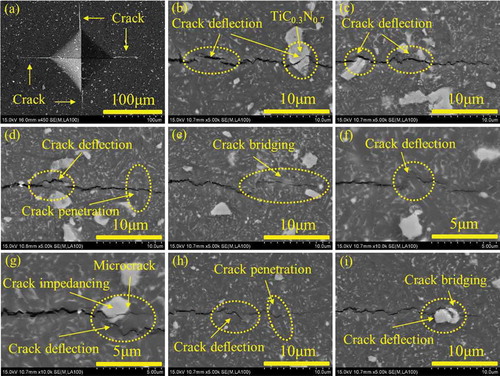
Figure 8. The thermal conductivity (κ) as a function of temperature (T) for the 1-SNT0, 1-SNT2, 1-SNT5 and 1-SNT7.5 samples after pressureless SPS at 1600°C for 20 min
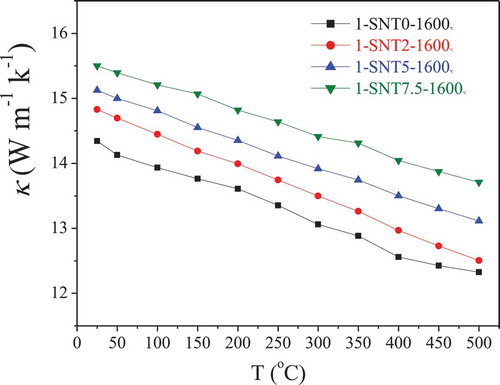
Figure 9. XRD patterns for the β-SiAlON/TiC0.3N0.7 composite samples: (a) 2-SNT5 with 5.0 wt.% TiC0.3N0.7 after further pressurized SPS at different temperatures and (b) 2-SNT0, 2-SNT2, 2-SNT5 and 2-SNT7.5 with 0, 2.0, 5.0 and 7.5 wt.% TiC0.3N0.7, respectively, after further pressurized SPS at 1400°C
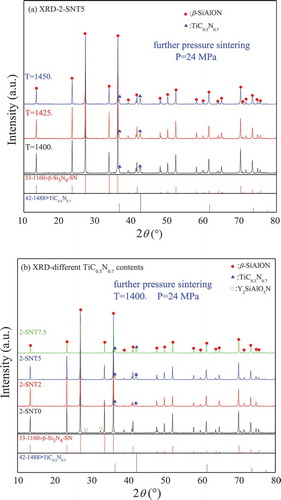
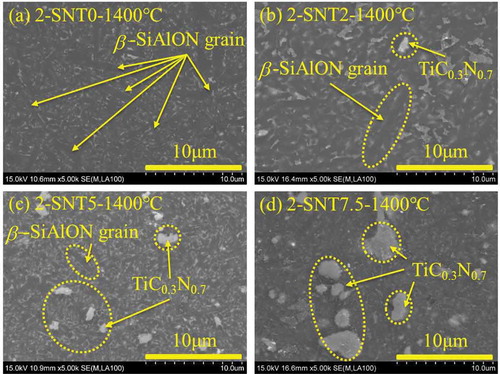
Figure 10. Typical back scattering electron micrographs on the polished surfaces of the representative samples: (a) 2-SNT0, (b) 2-SNT2, (c) 2-SNT5, (d) 2-SNT7.5 after further pressurized SPS at 1400°C for 5 min, which consist of the dark gray, bright white and white phase regions