Figures & data
Figure 1. Schematic of temperature measurement for an Al2O3 uniaxially pressed sample, using PTCR in a (a) conventional furnace and (b) microwave furnace.
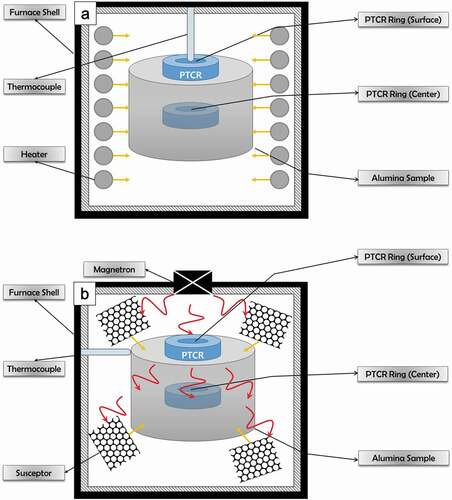
Table 1. Temperature measurement results
Figure 2. Schematic of an Al2O3 slip cast sample and the points of interest (s: surface; c: center).
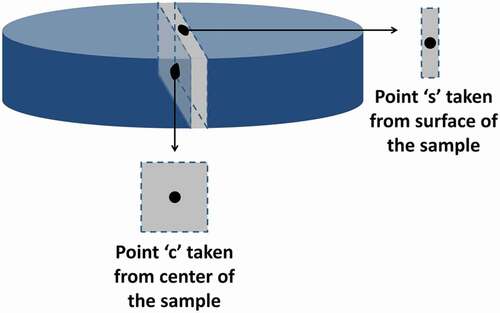
Figure 3. (a) FE–SEM microstructure, and (b) particle-size analysis of Al2O3 AKP–50 powder.
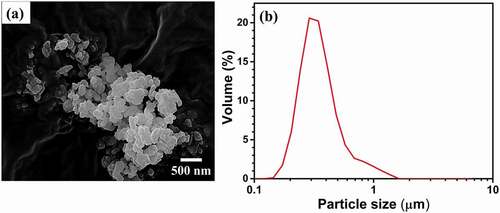
Figure 4. Rheology of Al2O3 slurry prepared for slip casting.
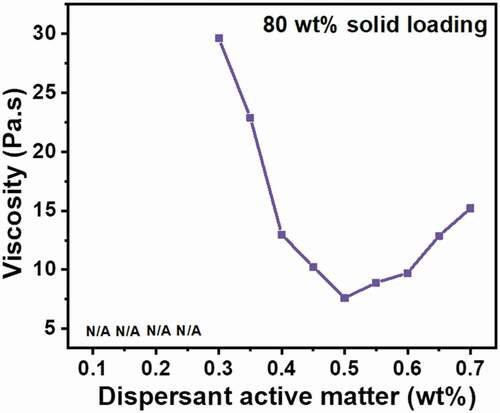
Figure 5. Measured temperature versus set temperature of the (a) conventionally sintered samples and (b) microwave-hybrid-sintered samples.
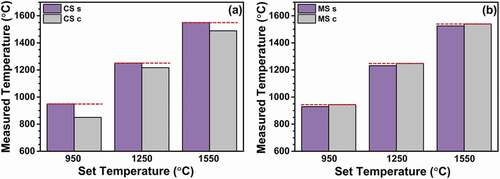
Figure 6. X-ray diffraction patterns of sintered Al2O3 (s: surface; c: center).
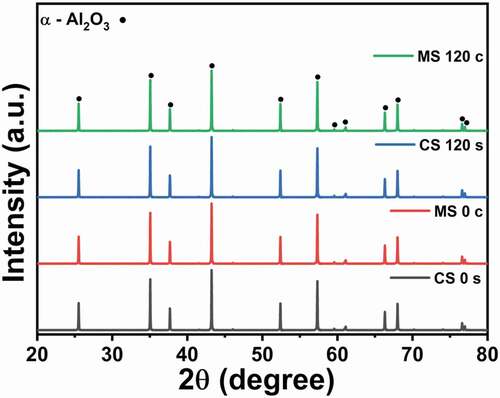
Figure 7. FE–SEM microstructures of conventionally sintered samples (s: surface; c: center).
Figure 8. FE–SEM microstructures of microwave-hybrid-sintered samples (s: surface; c: center).
Figure 9. Relative density of sintered samples (f: full compact; s: surface; c: center).
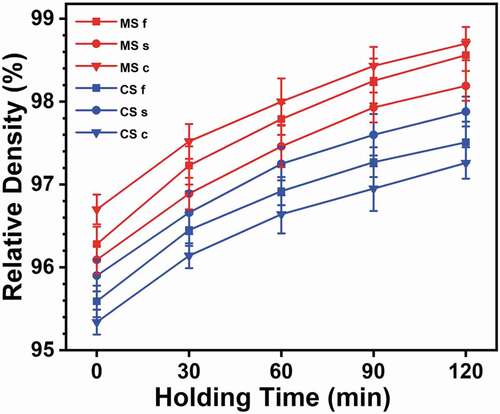
Figure 10. Grain-size distributions of (a) conventionally sintered samples and (b) microwave-hybrid-sintered samples, (c) average grain sizes at the surface and center points after different holding times, and (d) schematic showing the directions of the temperature gradient and grain growth during conventional and microwave sintering.
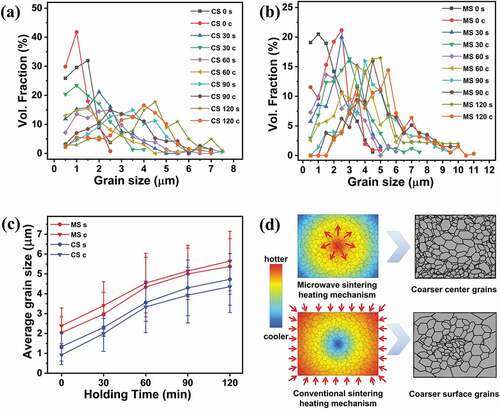
Table 2. Estimated temperatures from the measured temperatures using PTCRs
Figure 11. Estimated temperatures obtained from the linear-intercepts of the measured temperatures.
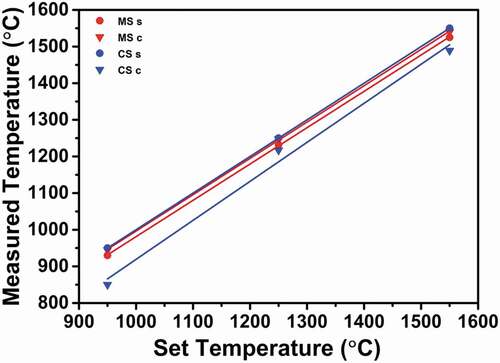
Figure 12. FE–SEM images showing the microstructures of the conventionally sintered samples at different set temperatures with no holding time (s: surface; c: center).
Figure 13. FE–SEM images showing the microstructures of microwave-hybrid-sintered samples at different set temperatures with no holding time (s: surface; c: center).
Figure 14. Average grain sizes at the surface and center points after sintering at different estimated temperatures.
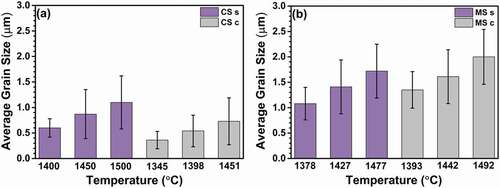
Figure 15. Estimated activation energy for grain-growth at the (a) surface and (b) center of the conventionally sintered samples, and that at the (c) surface and (d) center of the microwave-hybrid-sintered samples.
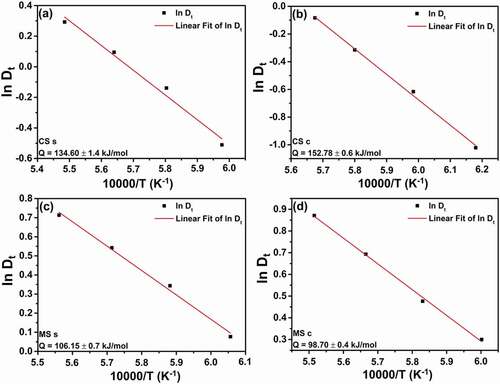
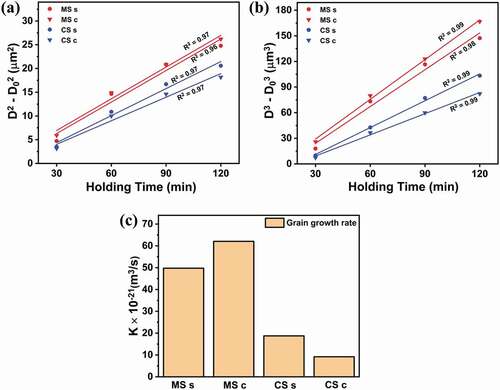
Figure 16. Grain-growth mechanism estimation with grain-growth constants n of (a) 2 and (b) 3, and (c) grain-growth rate (K) for conventionally sintered and microwave-hybrid-sintered Al2O3.