
Figures & data
Table 1. Sample symbols and categories.
Figure 1. X-ray diffraction patterns recorded for bulk samples: Al1, Al1.2, Al1.5, Al1Nb and Al1.2Nb.
Figure 2. Magnified images of Ti2AlC and Nb-doped Ti2AlC samples with various Al molar ratios after 2 − 14 d of isothermal oxidation in laboratory air at 800°C.
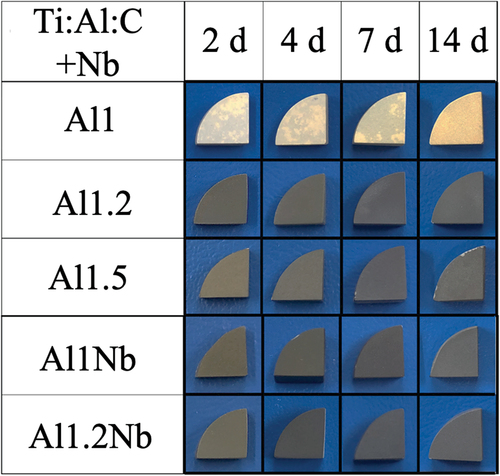
Figure 3. X-ray diffraction patterns recorded for samples Al1, Al1.2, Al1.5, Al1Nb and Al1.2Nb after 14 d of isothermal oxidation in laboratory air at 800°C.
Figure 4. SEM and EDS images of the cross-sections of samples Al1.2, Al1Nb and Al1.2Nb after 14 d of isothermal oxidation in laboratory air at 800°C.
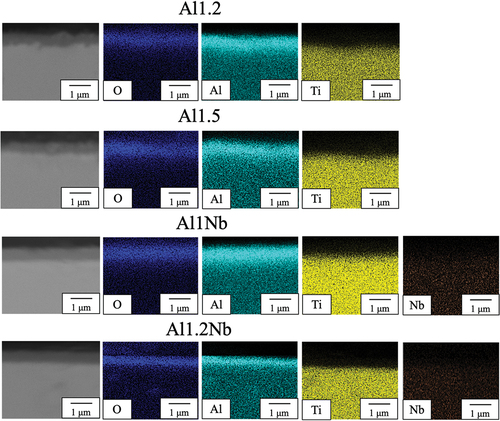
Figure 5. SEM and EDS images of the surface of Al1.2Nb after 14 d of isothermal oxidation in laboratory air at 800°C.
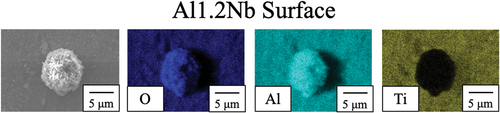
Figure 6. SEM and EDS images of the cross-sections of Al1 after 14 d of isothermal oxidation in laboratory air at 800°C.
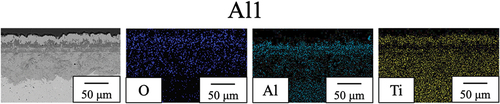
Figure 7. Oxide scale thickness (x) versus time (t) for Al1 oxidized at 800°C for 14 d.
Figure 8. Oxidation kinetics for all investigated samples over 150 h of isothermal oxidation in laboratory air at 800°C, presented in a linear plot.
Table 2. Parabolic rate constants of oxidation (kp) of all samples determined after 150 h of isothermal oxidation in laboratory air at 800°C.
Figure 9. Arrhenius plot showing the parabolic rate constants determined for the oxidation of Ni50AI50 [Citation19] and the kp values determined in the present experiment ().
![Figure 9. Arrhenius plot showing the parabolic rate constants determined for the oxidation of Ni50AI50 [Citation19] and the kp values determined in the present experiment (Table 2).](/cms/asset/eb32d78e-33ec-4e21-8f0f-77cc90878c5d/tace_a_2140497_f0009_b.gif)