Figures & data
Table 1. Chemical composition of H13 steel and NiCrSiB alloy powder (wt.%).
Figure 1. Schematic diagram of the fabrication process of UEPD coatings: (a) the UEPD electrode preparation; (b) the process of UEPD machining.
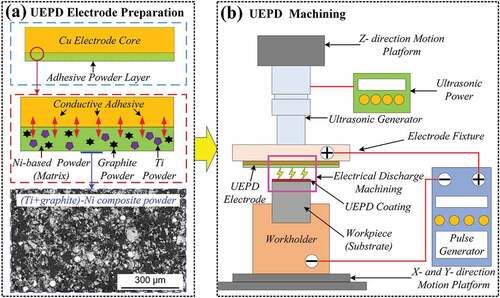
Figure 2. Schematic of the pin-on-disk friction and wear tester.
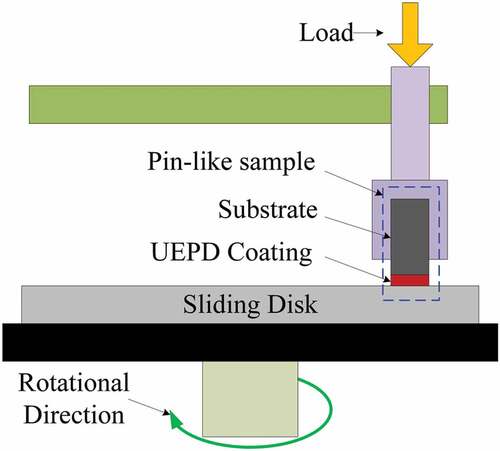
Figure 3. Morphologies of the composite coating: (a) cross-sectional view of the EPD coating; (b) surface view of the EPD coating and its (c) 3D image; (d) cross-sectional view of the UEPD coating; and (e) surface view of the UEPD coating and its (f) 3D image.
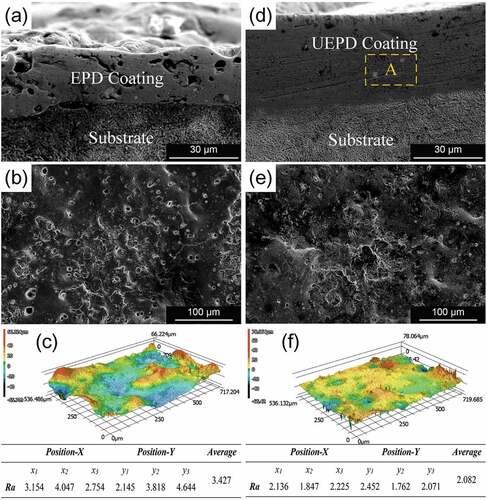
Figure 4. Microstructure of the UEPD coating: (a) cross-sectional view of the coating and (b) magnified BSE image for the marked region B; (c) BSE image showing the bright particles and the EDS for the marked particles.
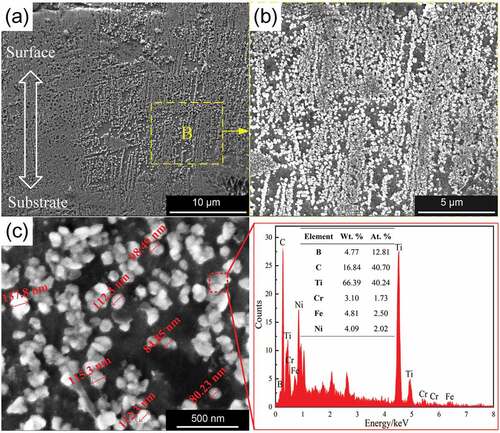
Figure 5. (a) Micrograph of the bonding zone between the UEPD coating and substrate and its (b-c) element distribution.
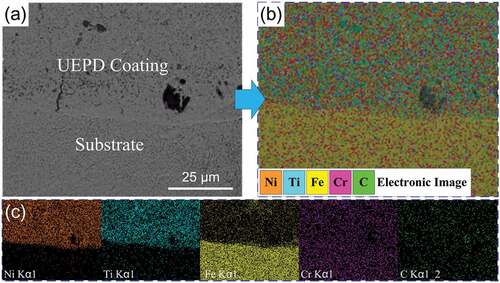
Figure 6. (a) BSE image denoted as A region in and 3b the EDS for the marked granules.
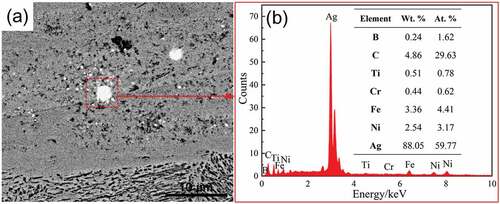
Figure 7. XRD pattern of the substrate, composite powder and UEPD coating.
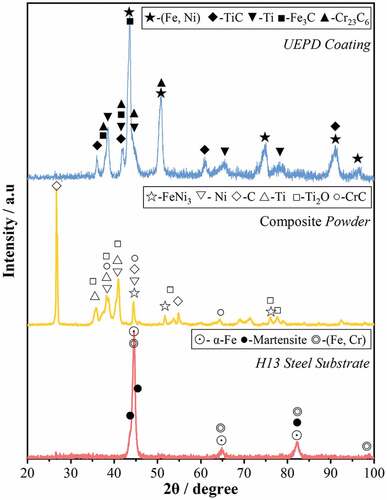
Figure 8. Schematic of transfer process of powder layer in one discharge cycle in the UEPD process: (a) Stage 1; (b-c) Stage 2; (d) Stage 3.
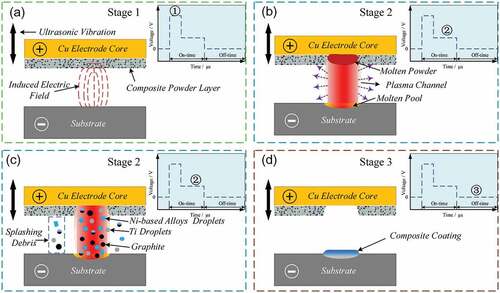
Figure 9. Microhardness profile of the in-situ TiC-Ni composite coating.
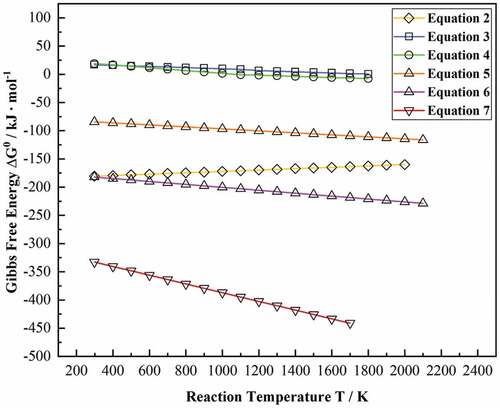
Figure 10. Diagram of the Gibbs free energy ΔG0 via the reaction temperature T.
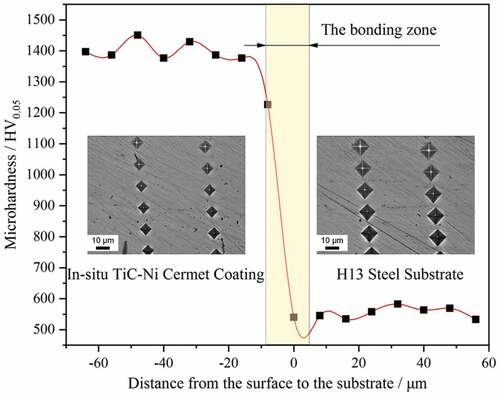
Table 2. Gibbs free energy of reactions as a function of temperature [Citation34–36].
Figure 11. (a) Calculated wear rates and (b) friction coefficients of the in-situ TiC-Ni composite coating and substrate.
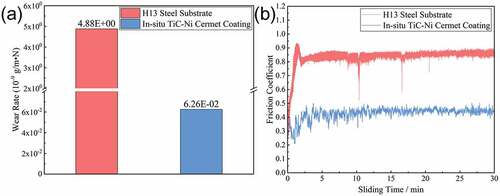
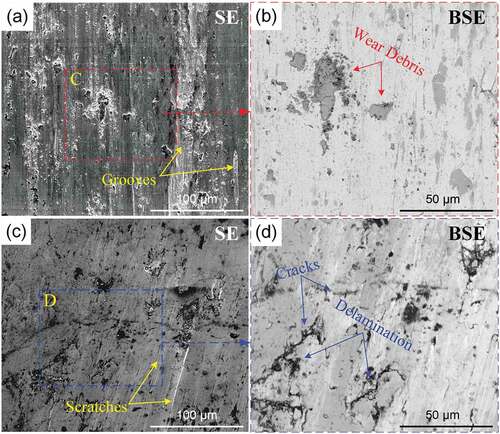
Figure 12. Wear morphologies: (a) SE images of the substrate and (b) the magnified BSE image for the marked region C; (c) SE image of the in-situ TiC-Ni composite coating and (d) the magnified BSE image for the marked region D.