Figures & data
Figure 1. FT-IR spectra and SEM images of the ZnO particles before (a) and after (b) surface treatment by APTES.
Figure 2. XRD patterns of ZnO single crystal particles (a) and composite particles prepared using (b) ZnO/APTES(n = 0), (c) ZnO/APTES(n = 0.5), (d) ZnO/APTES(n = 1.0), (e) ZnO/APTES(n = 3.0), (f) ZnO/APTES(n = 5.0) at reaction time 48 h. (B) shows the same patterns as (A) with the vertical axis expanded.
Figure 3. Crystallite size of composite particles calculated from (0 0 2) and (0 04) planes of HAp.
Figure 4. FT-IR spectra of ZnO single crystal particles (a) and composite particles prepared using (b) ZnO/APTES(n = 0), (c) ZnO/APTES(n = 0.5), (d) ZnO/APTES(n = 1.0), (e) ZnO/APTES(n = 3.0), (f) ZnO/APTES(n = 5.0) at reaction time 48 h.
Figure 5. SEM images of various HAp/ZnO/APTES composite particles.
Figure 6. Elemental mapping analysis of Zn, Ca and P of HAp/ZnO/APTES(n = 0–5.0) composite particles prepared at reaction time 48 h, performed by EPMA.
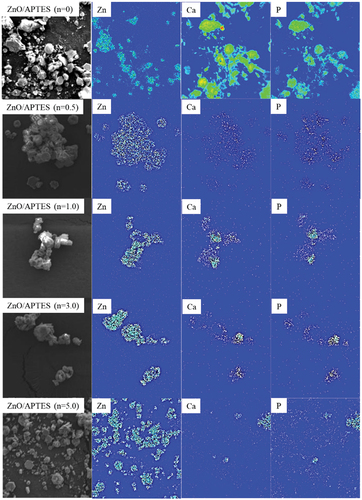
Figure 7. Changes in HAp precursor solution pH with increased reaction time.
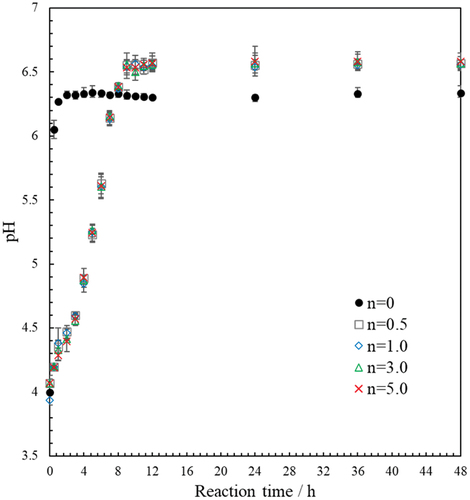
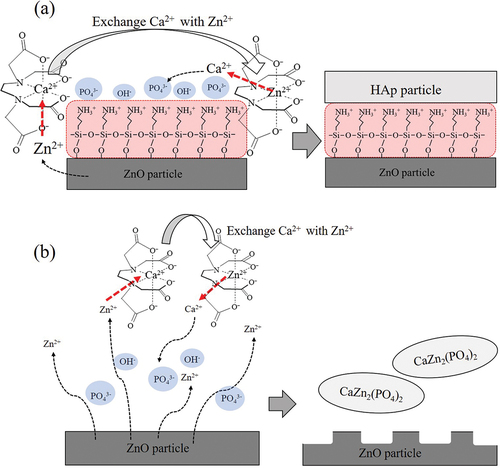
Figure 8. Schematic illustration of plate-like HAp/ZnO/APTES composite particles (a) and CaZn2(PO4)2 formation.