Figures & data
Figure 1. Finite element model for calculating dij of KICET-PZT8 ceramics: (a) 2D conceptual model and (b) 3D model.
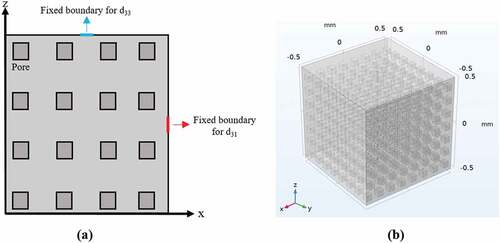
Figure 2. Flowchart for the property optimization of KICET-PZT8 using the finite element method.
Table 1. Effect of frequency of KICET-PZT8 in radial and thickness modes on various parameters.
Figure 3. Micrographs of sintered KICET-PZT8 ceramics with different porosities: (a) 7% (b) 13% (c) 22% (d) 30% (e) 39%.
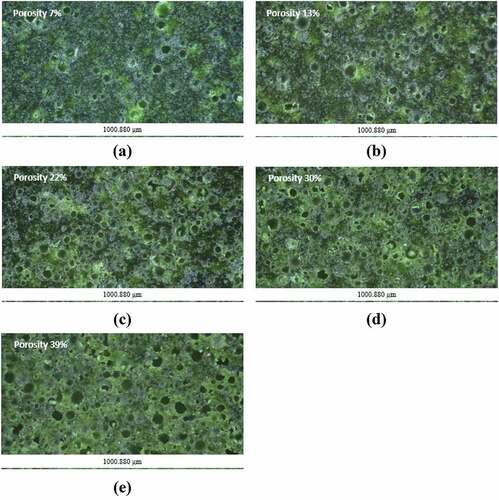
Table 2. Pore characteristics of the fabricated porous KICET-PZT8 ceramics according to PMMA vol%.
Figure 4. Calculated change in dij of KICET-PZT8 according to the number of pores at 30% porosity: (a) d33 (b) d31.
Figure 5. Simulation results of piezoelectric constant at various porosities: (a) d33 and d31 (b) dh (c) gh and (d) dh*gh.
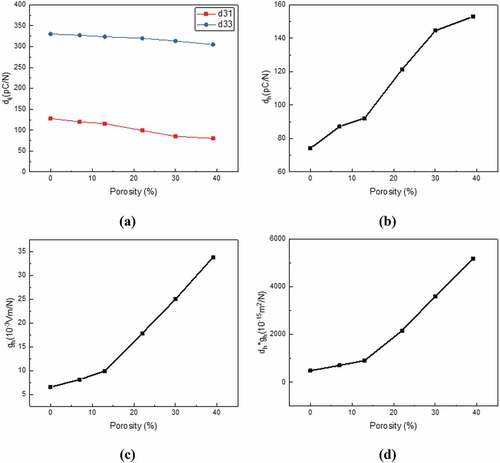
Table 3. Normalized mechanical and piezoelectric properties of KICET-PZT8 calculated using h-parametric estimation.
Figure 6. Fabricated KICET-PZT8 samples with various vibration modes to derive piezoelectric properties using a resonance method based on IEEE standards.
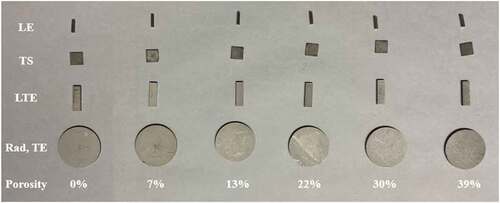
Figure 7. Comparison of the mechanical properties of KICET-PZT8 optimized through parametric estimation and experimental results with various porosities: (a) (b)
(c)
(d)
and (e)
.
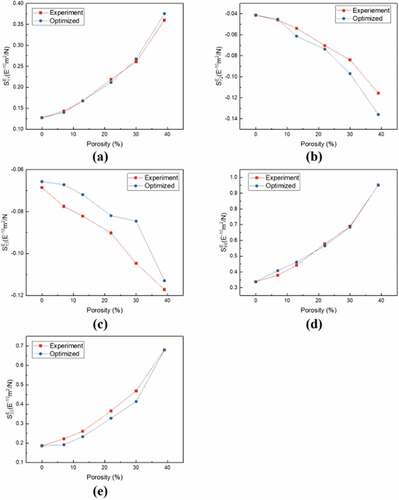
Figure 8. Comparison of piezoelectric and dielectric constants of KICET-PZT8 optimized through parametric optimization and experimental results with various porosities: (a) (b)
(c)
(d)
(e)
(f)
and (g)
.
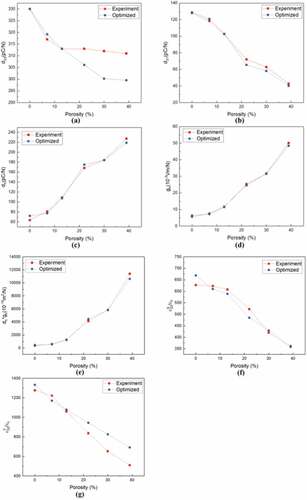
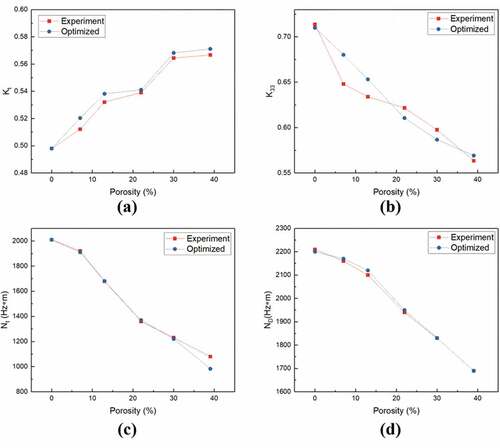
Figure 9. Comparison of coupling factors and frequency constants of KICET-PZT8 optimized through parametric optimization and experimental results with various porosities: (a) (b)
(c)
, and (d)
.