Figures & data
Figure 1. Schematic diagram of CVD reactor.
Table 1. Deposition parameters.
Figure 2. Schematic diagram of infrared emissivity calibration process.
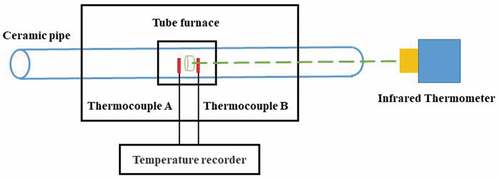
Figure 3. X-ray diffraction spectra of SiC coatings.
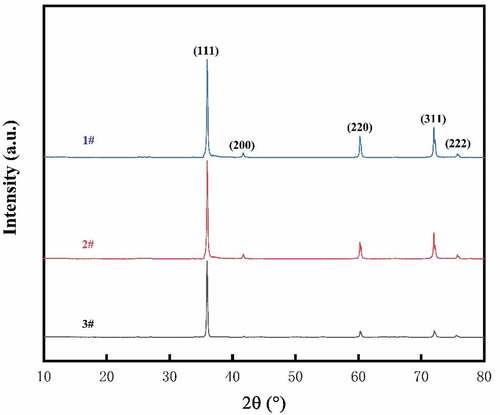
Figure 4. Three-dimensional topography of SiC coatings.
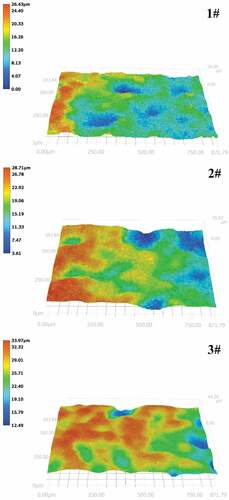
Figure 5. Average roughness of SiC coatings.
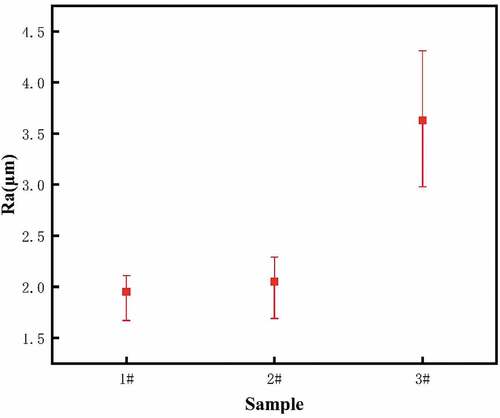
Figure 6. SEM images of SiC coatings.
Figure 7. Infrared emissivity of SiC coatings.
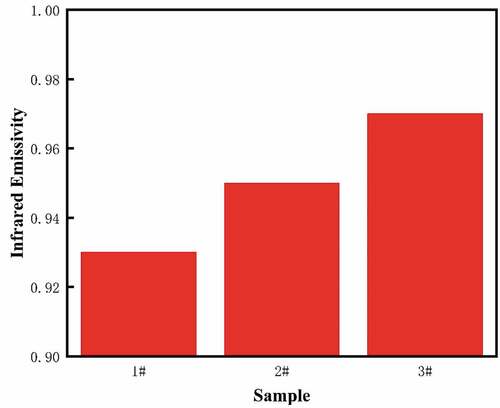
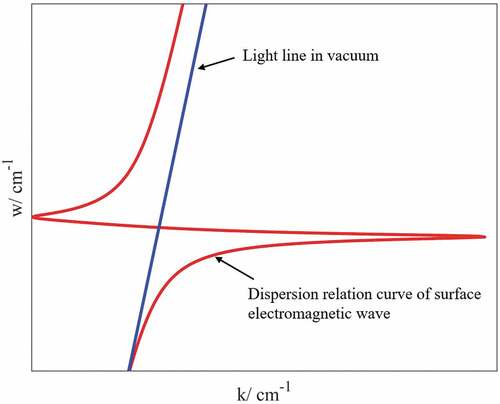
Figure 8. Dispersion relation curve of light wave propagation in vacuum and surface electromagnetic wave on SiC surface.