Figures & data
Figure 1. FE-SEM micrographs and distribution of the BNT–ST ceramics after the conventional sintering at sintering temperatures of (a) 1125°C, (b) 1150°C, (c) 1175°C, (d) 1200°C, and (e) 1225°C and (f) FE-SEM micrographs of the BNT–ST powder before the sintering process.
Figure 2. Relative density and average grain size of the BNT–ST ceramics as a function of the sintering temperature after the conventional sintering process.
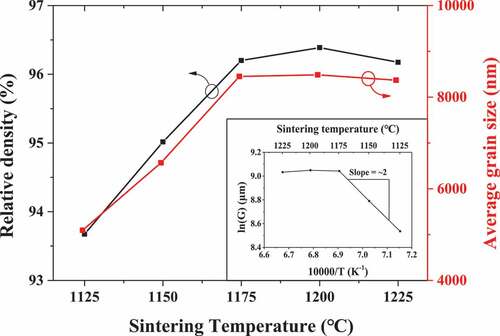
Figure 3. Plots of grain size versus sintering temperature for estimating Q after the conventional sintering process.
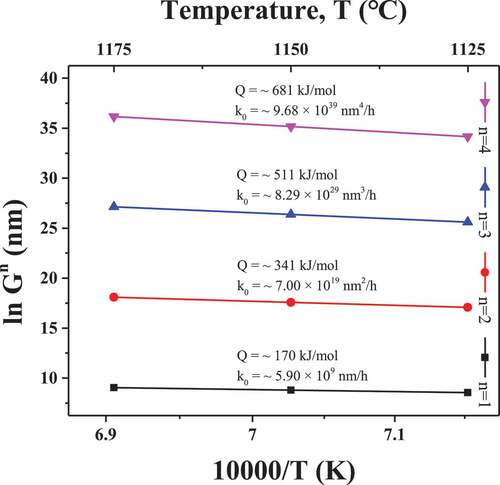
Figure 4. Piezoelectric charge coefficient, d33 and electromechanical coupling coefficients, kp of the BNT–ST ceramics after conventional sintering at sintering temperatures of 1125°C, 1150°C, 1175°C, 1200°C, and 1225°C.
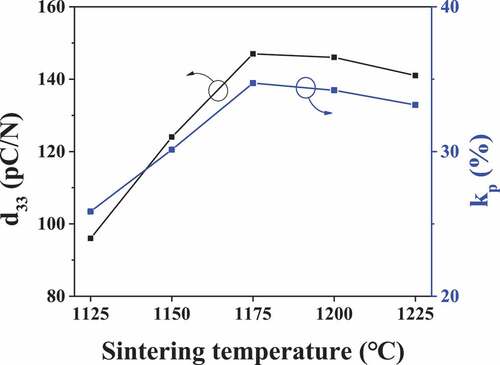
Figure 5. Average grain size and relative density of the BNT–ST ceramics as a function of t2 of the secondary sintering process.
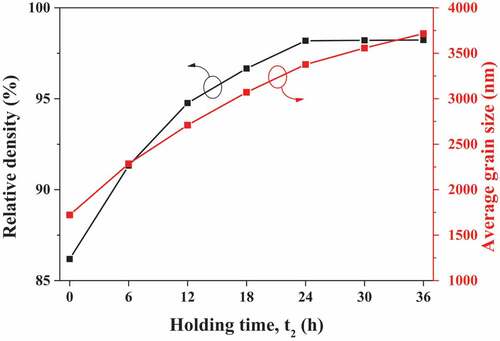
Figure 6. Ln G versus t2 plots for estimating the grain growth kinetic exponent (n) after two-step sintering.
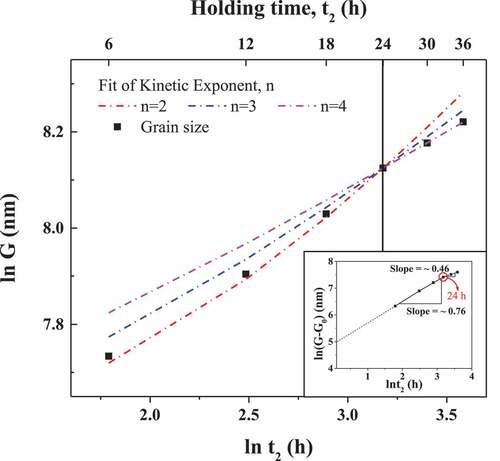
Table 1. Average grain size, n, and Q values based on the two-step sintering process.
Figure 7. FE-SEM micrographs and grain size distribution of the BNT–ST ceramics after two-step sintering at various t2: (a) 0 h, (b) 6 h, (c) 12 h, (d) 18 h, (e) 24 h, (f) 30 h, and (g) 36 h.
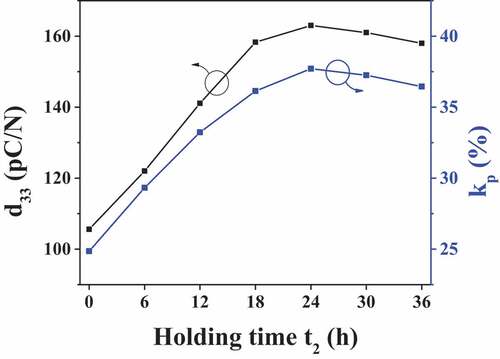
Figure 8. Piezoelectric charge coefficient, d33 and electromechanical coupling coefficients, kp of the BNT–ST ceramics after two-step sintering for various t2 of 0 h, 6 h, 12 h, 18 h, 24 h, 30 h, and 36 h.