Figures & data
Table 1. Chemical composition of nanosilica.
Figure 1. Schematic of a piezoelectric testing tool.
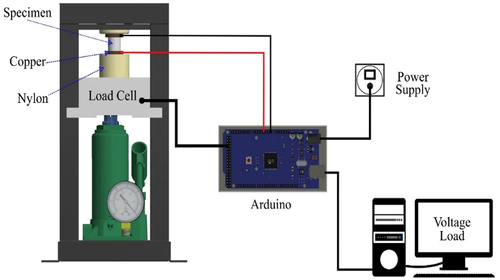
Figure 2. XRD patterns of nanosilica.
Figure 3. XRD patterns of sintered nanosilica at various temperatures.
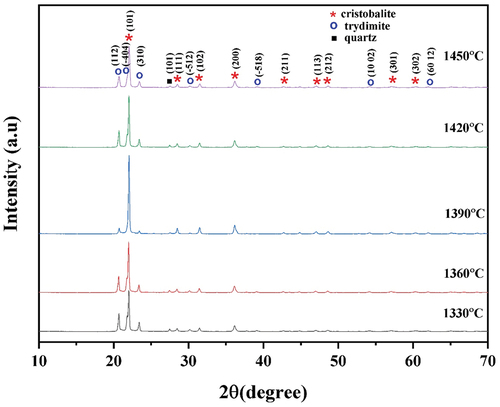
Figure 4. Effect of sintering temperature on the bulk density and relative density of sintered nanosilica ceramics.
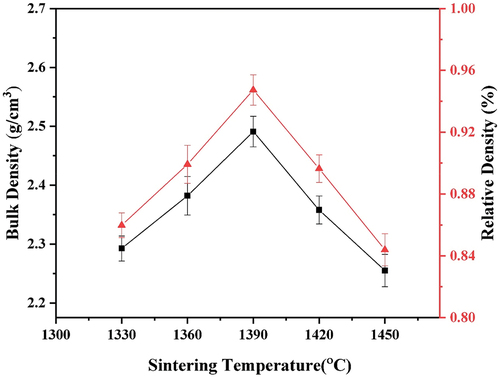
Figure 5. Images of nanosilica observed using: a). SEM and b). TEM.
Figure 6. SEM images of sintered nanosilica ceramic with various sintering temperatures, a). 1330°C, b). 1360°C, c). 1390°C, d). 1420°C, e). 1450°C.
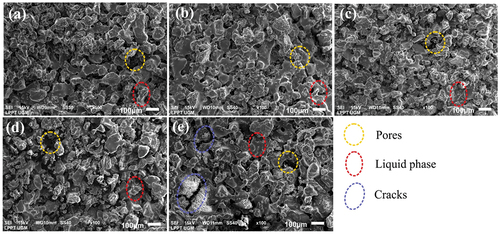
Figure 7. SEM/EDS test results of nanosilica at sintering temperature of 1390°C.
a). Element distribution result EDS, b). Image SEM c). Element Si, d). Element O, e). Element C, f). Element Na and g). Element Al.
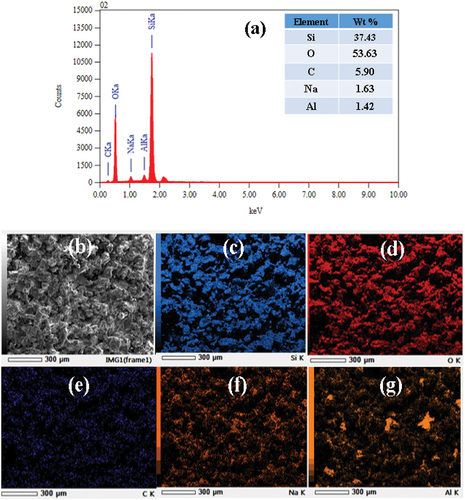
Figure 8. Effect of sintering temperature on compressive strength and diametral tensile strength of sintered nanosilica ceramics.
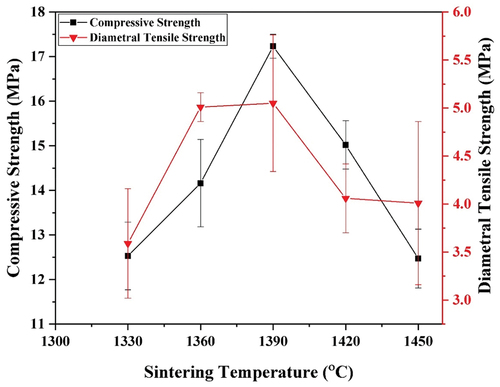
Figure 9. Frequency-dependent plot of permittivity for sintered nanosilica ceramic with variations of sintering temperature, (a) dielectric constant, and (b) dielectric loss.
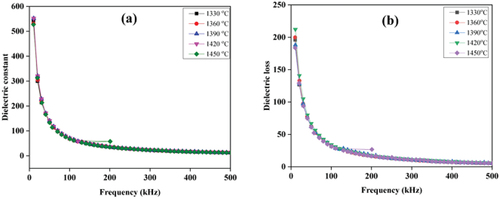
Figure 10. Direct piezoelectric effect within the simplified unit cell of sintered nanosilica ceramic longitudinal piezoelectric effect.
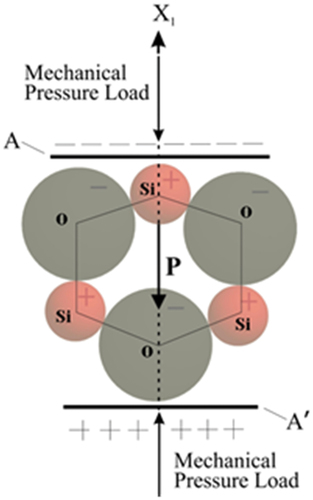
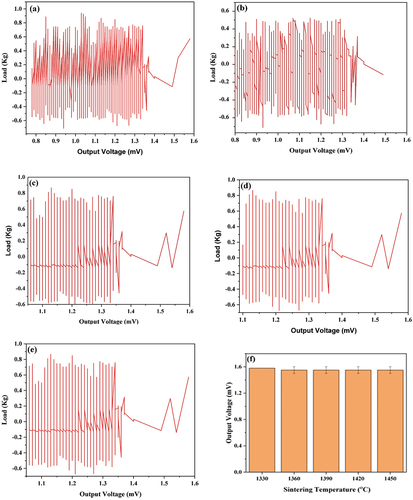
Figure 11. Signal display of the sintered nanosilica ceramic measurement results at sintering temperature variations of a) 1330°C, b) 1360°C, c) 1390°C, d) 1420°C, e) 1450°C, and f) maximum output voltage at each sintering temperature variation.