Figures & data
Figure 1. X-ray Diffraction (XRD) patterns of KCa2Nb3O10 (a) powder of varying K content after calcining at different calcination conditions, and (b) bulk samples after sintering at 1250°C for 2 hours.
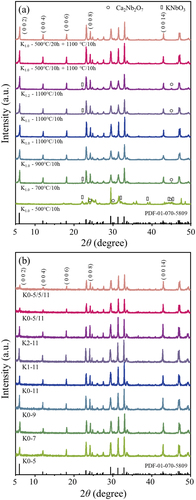
Figure 2. Room temperature dielectric constants (εr) and losses (tan δ in log-scale) of KCNO bulk samples with different (a) calcination temperature, (c) K content, and (e) number of calcination steps measured from 1k to 1 M Hz with 0 direct current (DC) bias and 1 Vrms. The εr (at 1k and 100k Hz) and relative densities (ρr) of the samples corresponding to (a, c, and e) are provided in (b, d, and f), respectively.
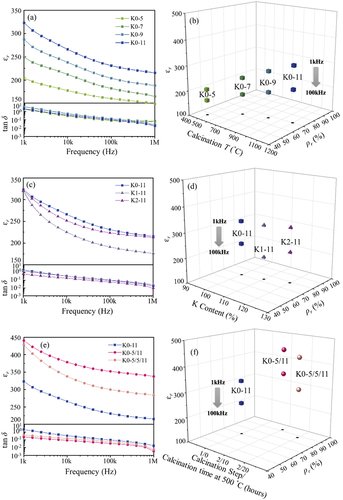
Figure 3. Electron Backscatter Diffraction (EBSD) image quality (IQ) maps and phase maps (KCNO, KNbO3, Ca2Nb2O7, and CaNb2O6 phases in red, blue, yellow, and green) of (a, b) “K0-11”, (c, d) “K2-11”, and (e, f) “K0-5/11”. The average grain sizes and areas of the samples are provided in the insets of (a, c, and e) and (b, d, and f), respectively.
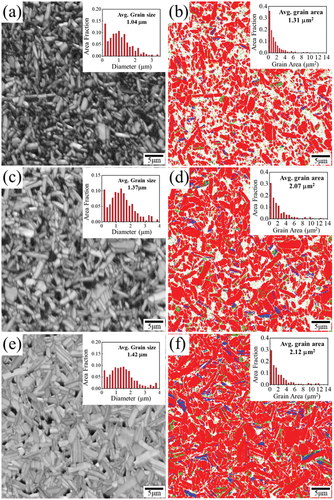
Table 1. Area fractions of KCNO, KNbO3, Ca2Nb2O7, CaNb2O6 phases, and pores in “K0-11”, “K2-11”, and “K0-5/11” samples.
Figure 4. εr (100k Hz) of “K0-11”, “K2-11”, and “K0-5/11” as functions of average grain size area, area fraction of KCNO phase, and ρr.
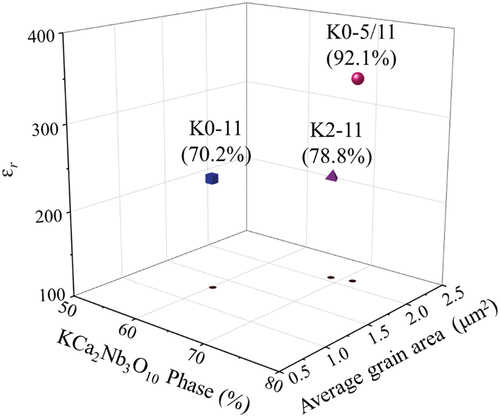
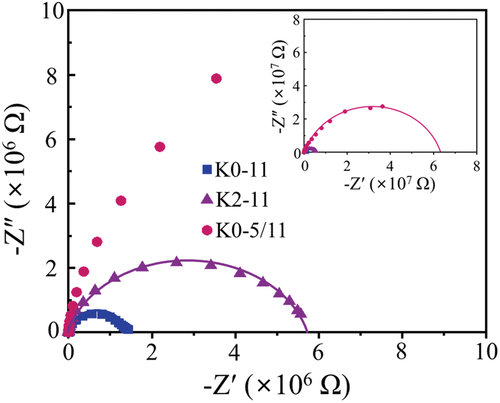
Figure 5. Cole-Cole plots of “K0-11”, “K2-11”, and “K0-5/11” measured with 1 Vrms at room temperature. The fitted semi-circle for “K0-5/11” is presented in the inset.