
Figures & data
Figure 1. A comparison between the energy storage features of SNLTx ceramics and other lead-free ceramics with prospective energy storage applications measured at 160 kV/cm.
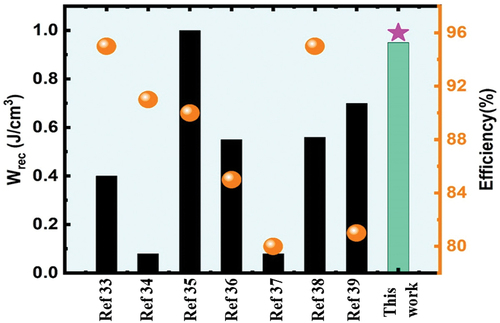
Figure 2. (a) X-ray diffraction patterns, (b) an enlargement view of the (001) and (111) plans to show the peak shifting, (c) high-resolution scanning transmission electron microscopy (HR-TEM) image shows the particle size of the calcined powder, and (d) selected area electron diffraction (SAED) for the SNLT8% sample.
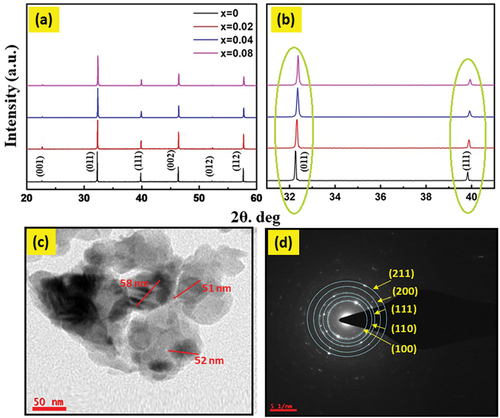
Figure 3. (a) shows SNLT4% ceramic XRD pattern Rietveld refinement. They are refined with Fullprof. Experimental data appear as black circles, whereas software-calculated intensities are portrayed as solid red lines. Allowed Bragg diffraction peaks are the green vertical lines. The blue curves at the graph’s bottom end show the difference between the experimental arrangement’s intensities and the refining program’s corresponding intensities. (b) the charge density maps of SNLT4%. The center contour and the region enclosed inside it correspond to the Ti4+ ion. Additionally, the four atoms surrounding the core ion, positioned at the midpoint of each side of the cube or pseudo-cube, represent the O2- anions, (c) variation of the unit cell constant and unit cell volume with co-dopant concentrations. (d) variation of crystallite size in nm and tolerance factor with co-dopant concentrations.
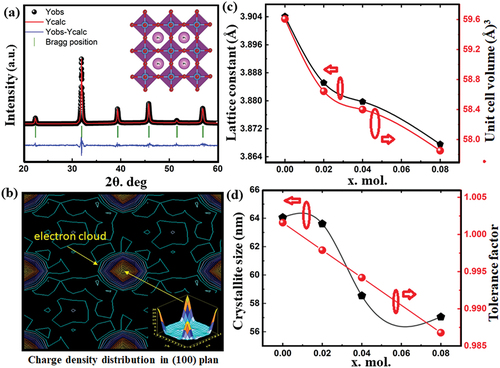
Table 1. The lattice parameter, unit cell volume, crystallite size, and tolerance factor of SNLTx ceramics as a function of Nd3+ and Li+ concentration.
Figure 4. Scanning electron microscopy (SEM) image of SNLTx ceramics sintered at (1300°C). The scale bar represents 10 micrometers, and the image was acquired at 10000x magnification. The images exhibit a uniform and dense distribution with different grain sizes.
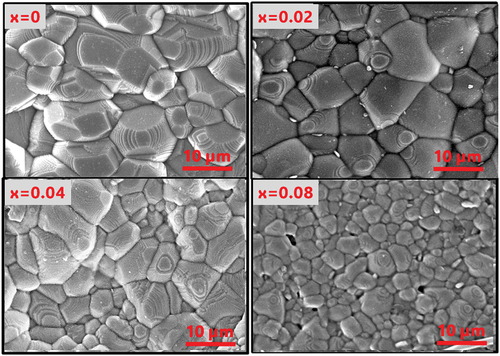
Figure 5. EDS elemental mapping images of 4% of Nd and Li co-doped SrTiO3 ceramic sample.
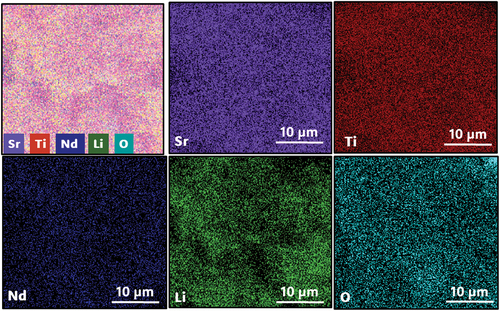
Figure 6. (a) an XPS survey is shown for the SNLT8% sample with all the significant peaks indicated, (b) high-resolution XPS spectra of Sr 3d, (c) high-resolution XPS spectra of Nd 3d, (d) high-resolution XPS spectra of Li 1s, (e) high-resolution XPS spectra of Ti 2p, and (f) high-resolution XPS spectra of O 1s.
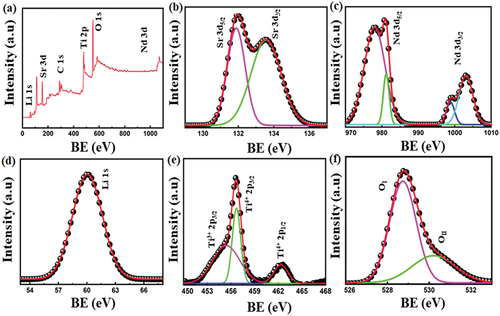
Figure 7. (a) frequency dependence of permittivity and loss tangent at room temperature for the SNLTx ceramics., (b, and c) temperature dependence of dielectric constant and loss tangent for the sample with x=0.08 measured at different frequencies namely 1 kHz, 10 kHz, 100 kHz, 1 MHz, and 2 MHz.
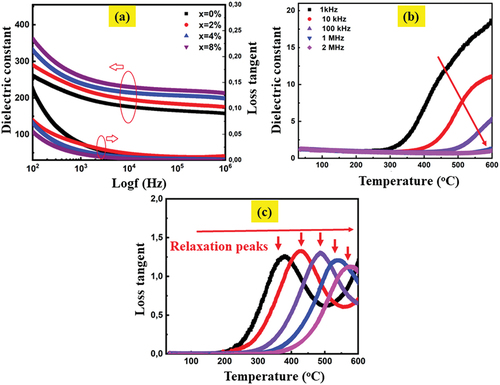
Figure 8. Room temperature P–E hysteresis loop with their schematic diagram for calculating the energy storage properties in SNLTx ceramics. The region colored in cyan corresponds to the recovered energy density (Wrec) or the energy density discharged during the discharge process. The area highlighted in yellow corresponds to the energy dissipation (Wloss) that transpires throughout the charge-discharge cycle. The sum of the energy gained (wrec) and the energy lost (Wloss) corresponds to the total energy density (Wtotal) accumulated during the charging procedure.
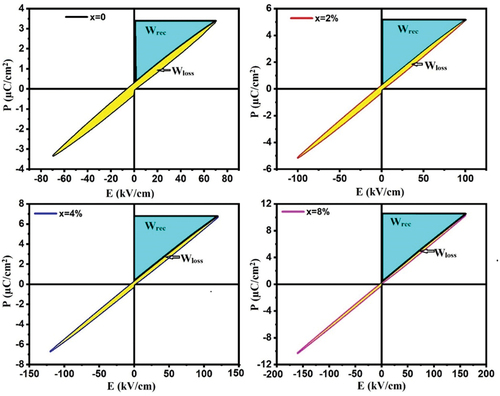
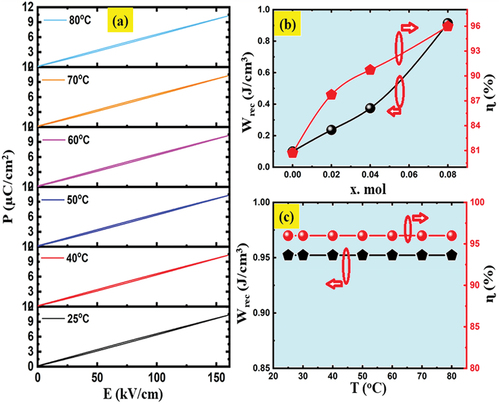
Figure 9. (a) P-E loops of the SNLT8% ceramic measured at different temperatures at 160 kV/cm and 10 Hz frequency. (b) the variation of Wrec and η values with co-dopants concentrations. (c) the energy storage density Wrec and energy storage efficiency η values were calculated from with different temperatures.
Data availability statement
All data generated or analyzed during this study are included in this article.