
Figures & data
Figure 1. Typical SEM micrographs of sintered (a) Ce-TZP/Al2O3 and (b) Y-TZP specimens.
Table 1. Microstructural characteristics of Ce-TZP/Al2O3 investigated in this study. Y-TZP specimens were also prepared for comparison.
Figure 2. (a) Thin section taken from the surface region of Ce-TZP/Al2O3 specimen before hydrothermal treatment. (b) TEM micrograph of the area indicated with a square in (a). (c) Diffraction pattern of the ZrO2 grain near surface (circled).
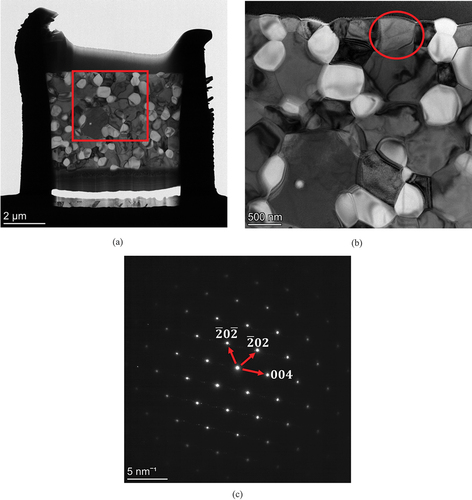
Figure 3. XRD diffraction patterns of (a) Ce-TZP/Al2O3 and (b) Y-TZP specimens before and after hydrothermal treatments for various times.
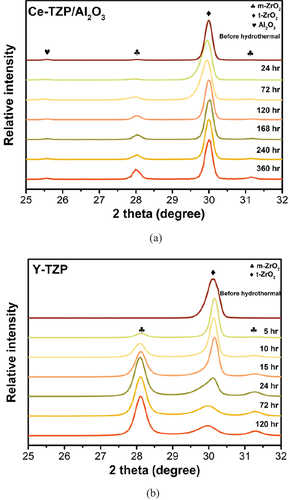
Figure 4. Amount of m-phase after hydrothermal treatment for various times.
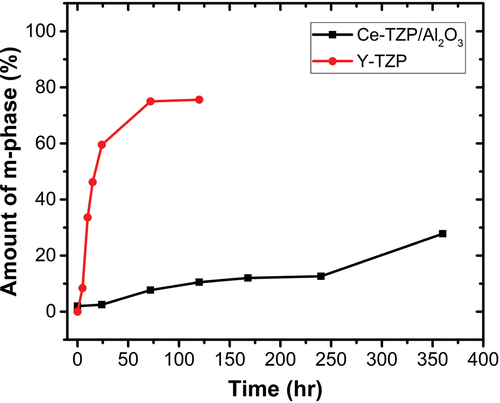
Figure 5. Fracture surfaces of (a) Ce-TZP/Al2O3 specimen after hydrothermal treatment for 360 h, and (b) Y-TZP specimens after hydrothermal treatment for 24 h.
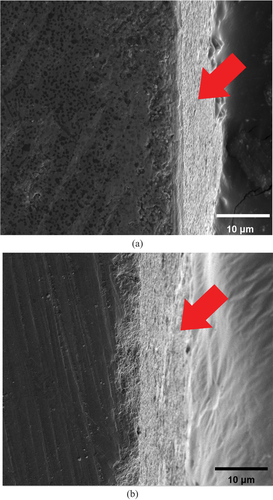
Figure 6. (a) Thin section taken from the surface region of Ce-TZP/Al2O3 specimen after hydrothermal treatment for 360 h. (b) TEM micrograph in the surface region as indicated with a square in (a). (c) TEM micrograph at higher magnification of the ZrO2 grain indicated with a square in (b). (d) Diffraction pattern of the ZrO2 grain shown in (c).
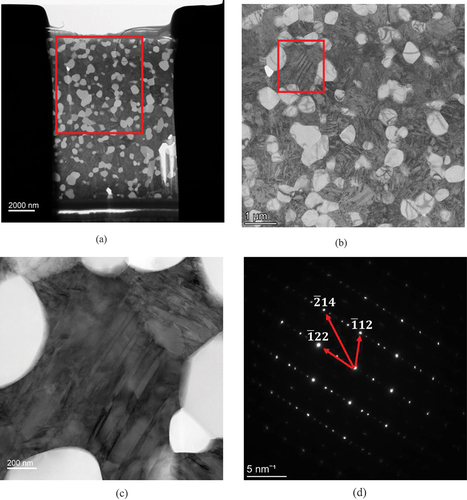
Figure 7. Weibull plots of (a) Ce-TZP/Al2O3 and (b) Y-TZP specimens before and after hydrothermal treatment.
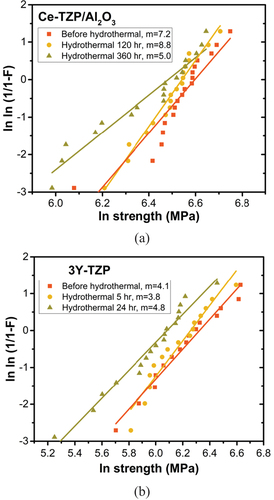
Figure 8. Biaxial strength of Ce-TZP/Al2O3 and Y-TZP specimens as a function of m-phase content.
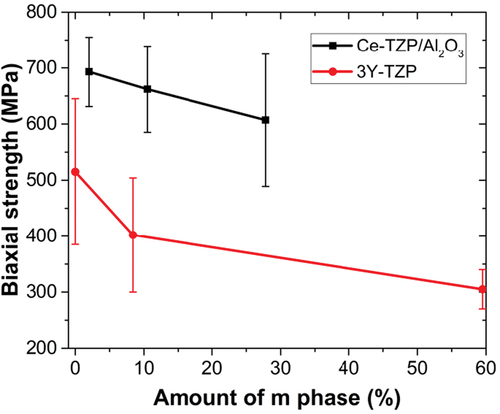
Figure 9. Loading-unloading-reloading curves of Ce-TZP/Al2O3 specimen (a) before and (b) after hydrothermal treatment. The time for hydrothermal treatment of the specimen in (b) was 120 h.
Figure 10. (a) Thin section taken from the surface region of Y-TZP specimen after hydrothermal treatment for 24 h. (b) TEM micrograph in the surface region as indicated with a square in (a).
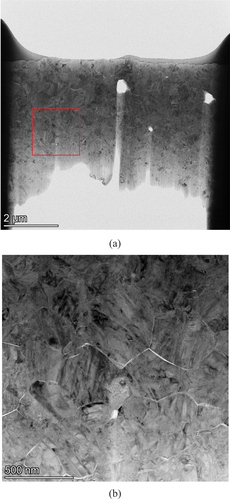
Table 2. Hydrothermal resistance of the Ce-TZP/Al2O3 and Y-TZP prepared in this study; corresponding data can be found in the figures indicated in brackets.