
Figures & data
Figure 1. Equilibrium phase diagram CaO – Al2O3 – SiO2 [Citation23]: the theoretical melting temperatures of the test samples; ISQC (1), KAQC (2), ISAC (3) and KAAC (4).
![Figure 1. Equilibrium phase diagram CaO – Al2O3 – SiO2 [Citation23]: the theoretical melting temperatures of the test samples; ISQC (1), KAQC (2), ISAC (3) and KAAC (4).](/cms/asset/bf04113a-61e3-4fee-a41c-d6dac9604b09/tace_a_2320448_f0001_b.gif)
Table 1. Composition and identification of test samples (wt.%).
Table 2. Chemical composition of the plastic raw materials in wt.% (LOI – loss on ignition).
Figure 2. Dilatometric curves of the KAAC, KAQC, ISAC and ISQC test samples.
Figure 3. Sintering curves – the effect of firing temperature on water absorption and the determination of sintering temperature Ts.
Figure 4. XRD patterns of the test samples fired at 950°C (A – anorthite, Q – quartz, W-wollastonite, Al – corundum, mu – muscovite).
Figure 5. XRD patterns of the test samples fired at 1050°C (A – anorthite, Q – quartz, Al – corundum).
Figure 6. XRD patterns of the test samples fired at 1150°C (A – anorthite, Q – quartz, M – mullite, C – cristobalite, Al – corundum), ISQC is already sintered ().
Figure 7. XRD analysis of sintered bodies at the sintering temperature Ts, according to (A – anorthite, M – mullite, C – cristobalite, Al – corundum).
Table 3. Summary of mineral composition of sintered bodies – quantitative XRD analysis.
Figure 8. Change in the length of sintered bodies for the determination of the coefficient of linear thermal expansion, CLTE.
Table 4. Coefficient of linear thermal expansion (CLTE) of sintered bodies in the temperature range of 30–700°C. Modulus of rupture (MOR) at sintering temperature.
Figure 9. SEM – examples of typical fractured surface of ISQC (a) and KAQC (b) sintered bodies without HF application.
Figure 10. SEM – microstructure of fractured and HF etched sintered body KAAC (al-corundum, A-anorthite).
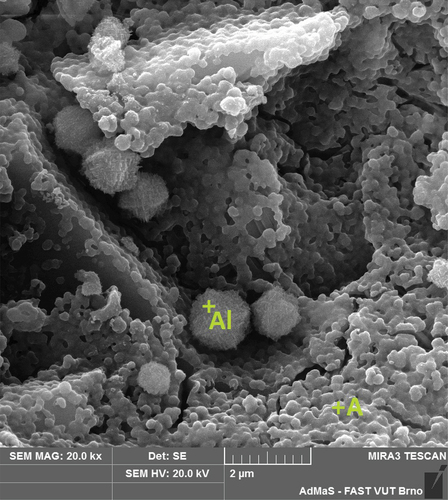
Figure 11. SEM – microstructure of fractured and HF etched sintered body KAQC (M-mullite, A-anorthite).
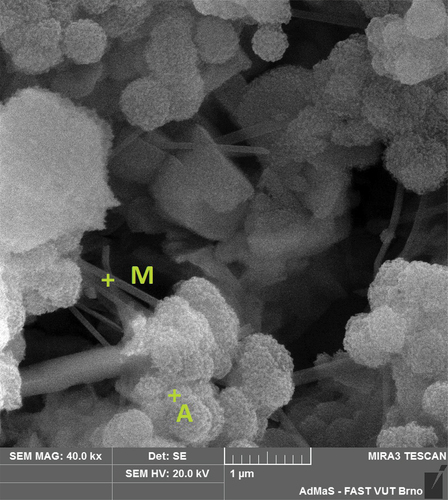
Figure 12. SEM – microstructure of fractured and HF etched sintered body ISQC (A-anorthite).
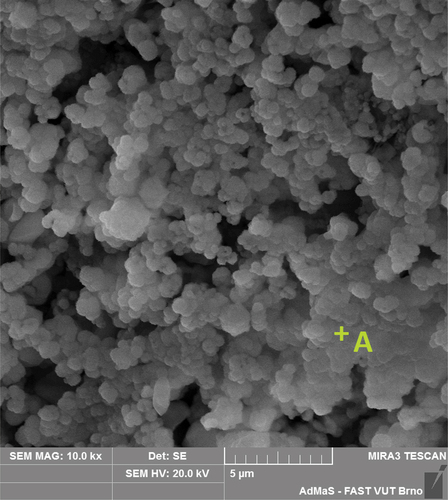
Table 5. Results of the EDS analysis at the points highlighted in the SEM microphotographs.
Data availability statement
The data presented in this paper are available upon request from the corresponding author.