Figures & data
Figure 1. X-ray diffraction pattern of the CTs.
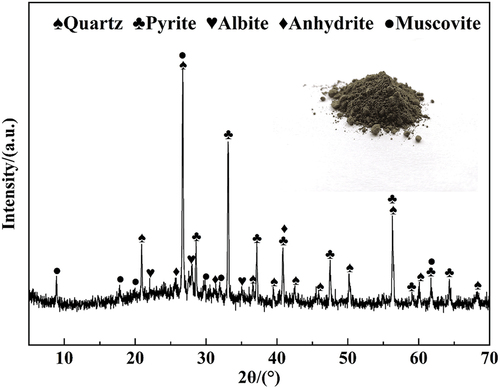
Table 1. The chemical composition of the raw materials (wt.%).
Table 2. The designed sintering parameters of samples.
Figure 2. The height and morphology variation of the sample projection during the heating process.
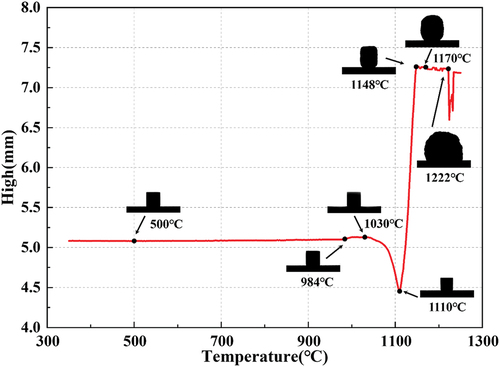
Figure 3. The physical properties of samples with different sintering temperatures: (a) apparent porosity and total porosity, (b) bulk density and water absorption.
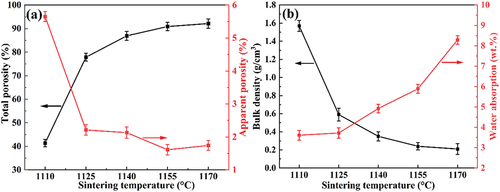
Figure 4. Pore morphology and pore size distribution of samples with different sintering temperatures: (a) 1110°C, (b) 1125°C, (c) 1140°C, (d) 1155°C, (e) 1170°C, (f) pore size distribution.
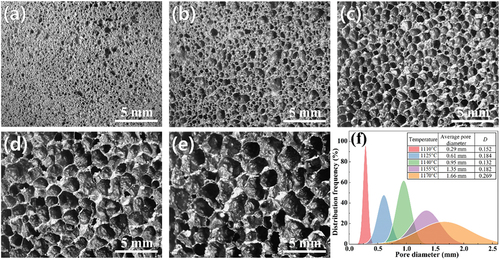
Figure 5. XRD patterns of samples with different sintering temperatures.
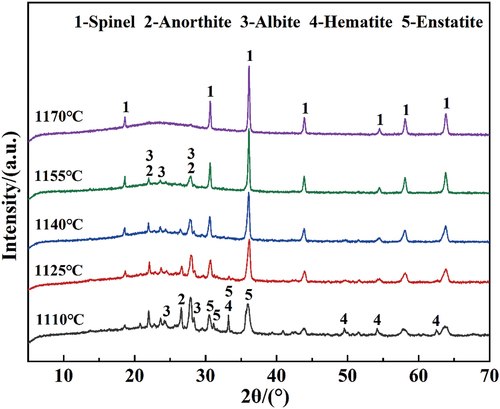
Figure 6. The physical properties of samples with different holding times: (a) total porosity and apparent porosity, (b) bulk density and water absorption.
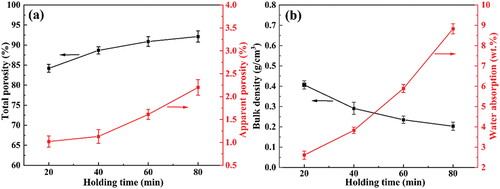
Figure 7. Pore morphology and SEM images of samples with different holding times: (a) 20 min, (b) and (e) 40 min, (c) 60 min, (d) and (f) 80 min.
Figure 8. XRD patterns of samples with different holding times.
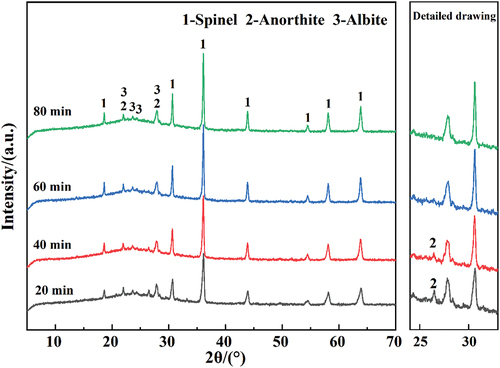
Figure 9. The TG-DTG-MS curves of the green body.
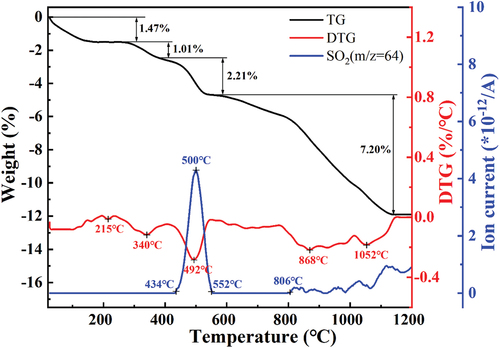
Figure 10. Pore morphology and average pore size of samples with different heating rates: (a)1°C/min, (b) 2°C/min, (c) 4°C/min, (d) 8°C/min, (e) average pore.
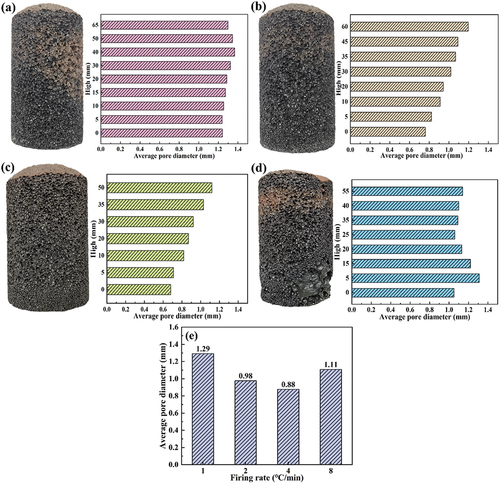
Figure 11. The Fe2P XPS spectra of samples at 8°C/min: (a) bottom of the sample, (b) top of the sample.
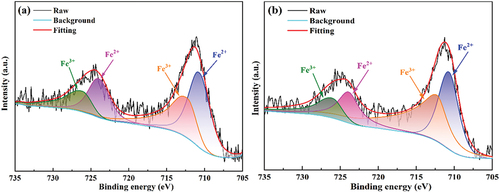
Figure 12. SEM images of the samples at 8°C/min: (a-c) top of the samples, (d-f) bottom of the samples.
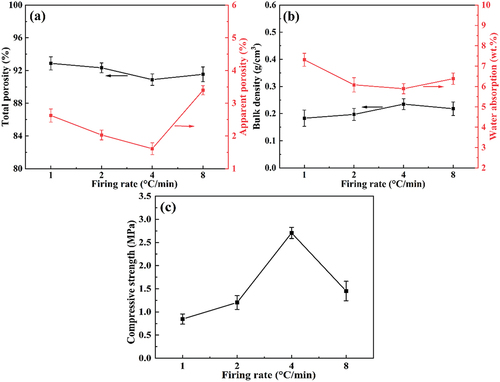
Figure 13. The physical properties of samples with different firing rates: (a) total porosity and apparent porosity, (b) bulk density and water absorption, (c) compressive strength.