
Figures & data
Figure 1. Crystal structure of (Mg0.95Co0.05)2(Ti0.97Sn0.03)O4 as the same Mg2TiO4.
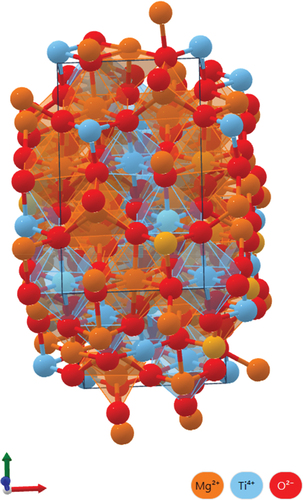
Figure 2. X-ray diffraction patterns of (1-y)(Mg0.95Co0.05)2(Ti0.97Sn0.03)O4 - y(Ca0.95Sr0.05)(Ti0.97Sn0.03)O3 ceramics sintered at 1325°C for 4 h.
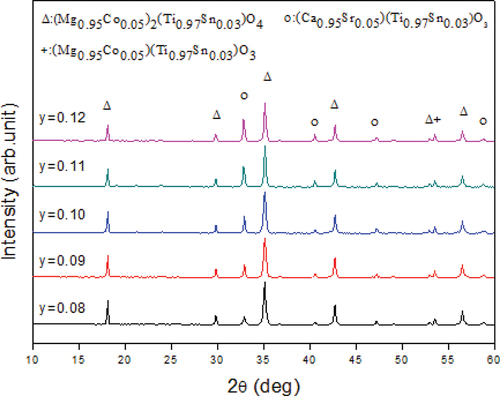
Figure 3. X-ray diffraction patterns of a 0.92(Mg0.95Co0.05)2(Ti0.97Sn0.03)O4-0.08(Ca0.95Sr0.05)(Ti0.97Sn0.03)O3 ceramic sintered at various temperatures.
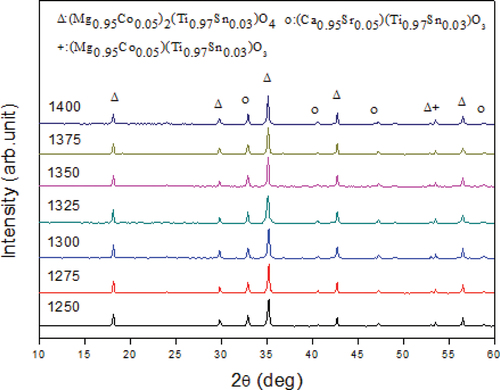
Figure 4. SEM micrographs of 0.92(Mg0.95Co0.05)2(Ti0.97Sn0.03)O4 - 0.08(Ca0.95Sr0.05)(Ti0.97Sn0.03)O3 ceramics sintered at various temperatures.
Figure 5. The marks of SEM for the 0.92(Mg0.95Co0.05)2(Ti0.97Sn0.03)O4 - 0.08(Ca0.95Sr0.05)(Ti0.97Sn0.03)O3 ceramics sinter at 1375°C.
Table 1. EDX data of 0.92(Mg0.95Co0.05)2(Ti0.97Sn0.03)O4- 0.08(Ca0.95Sr0.05)(Ti0.97Sn0.03)O3 ceramics for areas A and B.
Figure 6. Relative density of (1-y)(Mg0.95Co0.05)2(Ti0.97Sn0.03)O4 - y(Ca0.95Sr0.05)(Ti0.97Sn0.03)O3 ceramics sintered at various temperatures.
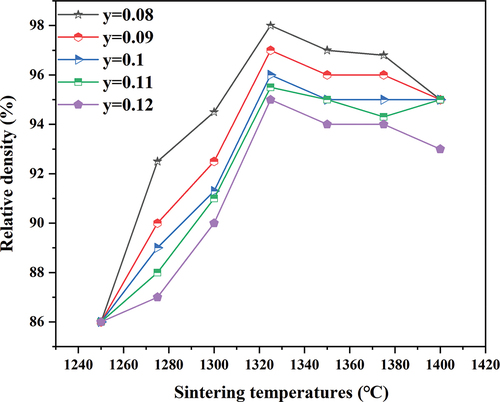
Figure 7. Dielectric constant curves of (1-y)(Mg0.95Co0.05)2(Ti0.97Sn0.03)O4- y(Ca0.95Sr0.05)(Ti0.97Sn0.03)O3 ceramics sintering at different temperatures for 4 hrs.
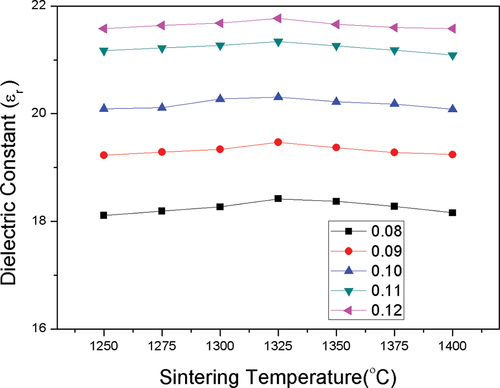
Table 2. Microwave dielectric properties of the (1-y)(Mg0.95Co0.05)2(Ti0.97Sn0.03)O4- y(Ca0.95Sr0.05)(Ti0.97Sn0.03)O3 ceramics sintered at 1325°C for 4 hrs.
Figure 8. Q×f values of (1-y)(Mg0.95Co0.05)2(Ti0.97Sn0.03)O4 - y(Ca0.95Sr0.05)(Ti0.97Sn0.03)O3 ceramics sintered at various temperatures for 4 h.
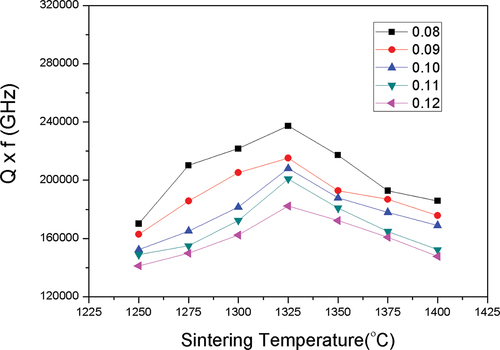
Figure 9. τf values of (1-y)(Mg0.95Co0.05)2(Ti0.97Sn0.03)O4 - y(Ca0.95Sr0.05)(Ti0.97Sn0.03)O3 system sintering at different temperatures for 4 h.
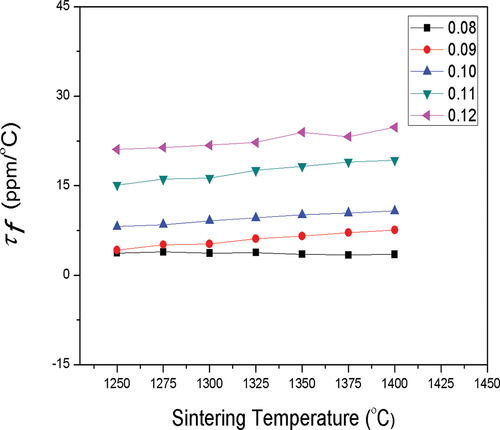
Figure 10. Layout of a band-pass filter with a (1-y)(Mg0.95Co0.05)2(Ti0.97Sn0.03)O4 - y(Ca0.95Sr0.05)(Ti0.97Sn0.03)O3 ceramic substrate.
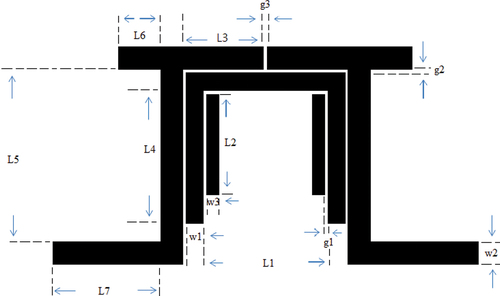
Table 3. Simulation results of the Band-Pass Filters Using Different Dielectrics.
Data availability statement
The data supporting the findings of this study are openly available to the reviewers.