Figures & data
Figure 1. DSC curve obtained with YH2, B4C and C mixture at a heating rate of 10 °C/min up to 1450°C under a flowing Ar atmosphere.
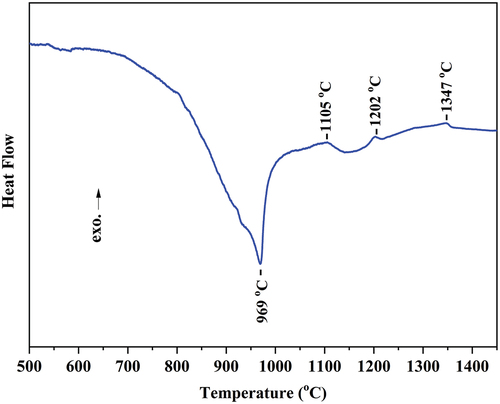
Figure 2. XRD patterns of mixed powders at (a) RT, and after sintering at (b) 1000 °C, (c) 1150 °C, (d) 1250 °C, (e) 1450°C.
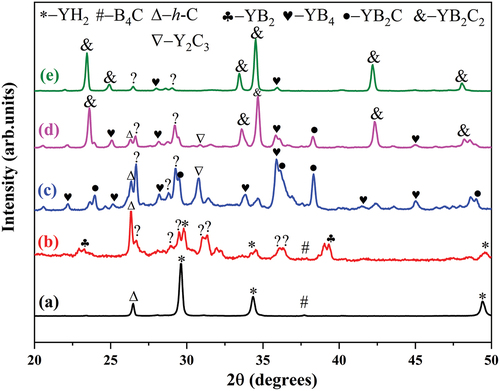
Figure 3. ΔG and ΔH curves of dehydrogenation reaction of YH2.
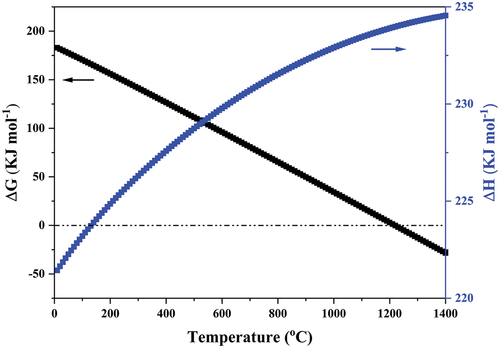
Figure 4. XRD patterns of mixed powders with a molar ratio of YH2:B4C:C = 1.95:0.9:2.95 after sintering at 1600°C.
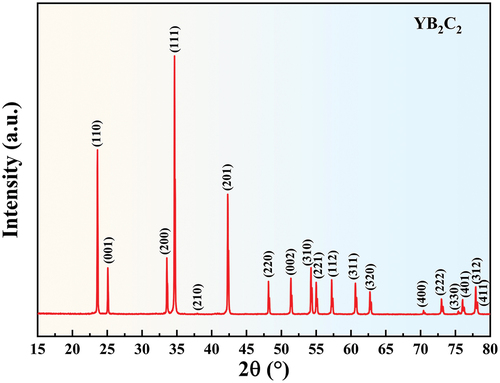
Figure 5. Simulated electron diffraction patterns of the P_42c (a, b) and P4/mbm (c, d) structure along the [010] (a,c) and [001] (b,d) zone axes. Red dots in (d) show the positions of extinction diffraction spots. For the two structures, the diffraction patterns along [100] are identical to those along [010] and not provided here for brevity. Experimental selected area electron diffraction patterns along [010] (e), [1_10] (f) and [001] (g). Convergent beam electron diffraction pattern along [001]. The green and pink lines denote the mirror planes.
![Figure 5. Simulated electron diffraction patterns of the P_42c (a, b) and P4/mbm (c, d) structure along the [010] (a,c) and [001] (b,d) zone axes. Red dots in (d) show the positions of extinction diffraction spots. For the two structures, the diffraction patterns along [100] are identical to those along [010] and not provided here for brevity. Experimental selected area electron diffraction patterns along [010] (e), [1_10] (f) and [001] (g). Convergent beam electron diffraction pattern along [001]. The green and pink lines denote the mirror planes.](/cms/asset/118daa2b-da0e-465e-8038-9f059eafe20c/tace_a_2350830_f0005_oc.jpg)
Figure 6. Powder XRD spectra of YB2C2: observed spectrum (the × black dotted line), Rietveld generated spectrum (the red upper solid line) and difference between the two (the bottom purple solid line). The blue vertical ticks below the pattern represent possible bragg reflections of YB2C2.
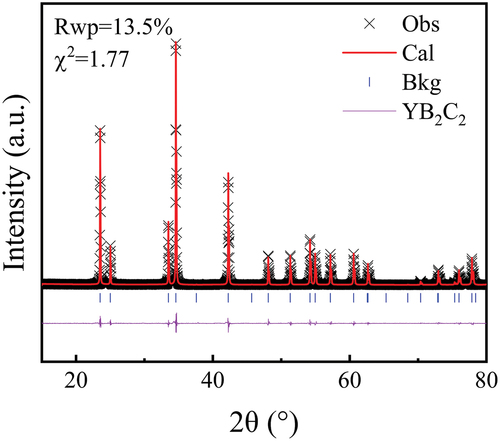
Table 1. Calculated (cal.) and experimental (Obs.) data of reflections, 2θ positions and intensity for YB2C2.
Table 2. Comparison of lattice constants of YB2C2 derived from first-principles calculation, Rietveld refinement, electron diffraction, and from literature.
Figure 7. (a) Total and projected electronic density of states (DOS) of YB2C2; (b) Mulliken population and bond length of chemical bonds in YB2C2; (c) pressure dependence of lattice constants a and c; (d) relative bond-length contractions for YB2C2 at various pressures.
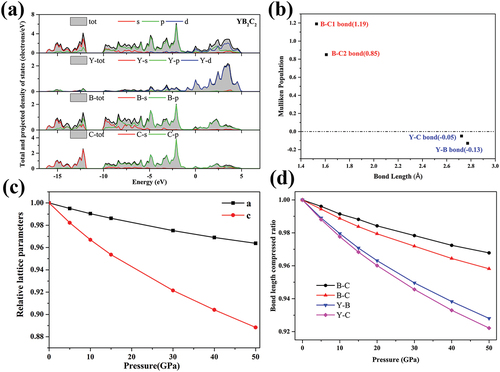
Table 3. Second order elastic constants cij, anisotropic Young’s modulus ex and Ez, bulk modulus B, shear modulus G, Young’s modulus E and Poisson’s ratio of YB2C2.
Figure 8. Dependence of the retained flexural strength of YB2C2 and several other structural ceramics on the quenching temperature.
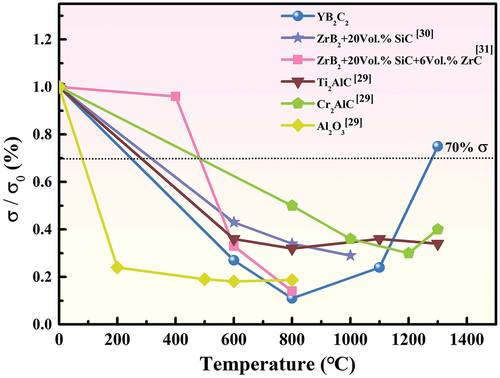
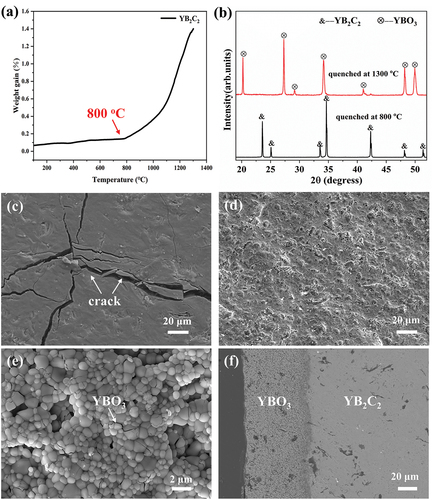
Figure 9. (a) TG curve of YB2C2 at 100–1300 °C; (b) XRD patterns of the YB2C2 sample surface after quenching at 800°C and 1300 °C; (c) SEM morphology of the YB2C2 sample surface after quenching at 800 °C; (d) SEM morphology of the YB2C2 sample surface after quenching at 1300 °C; (e) is a partial enlargement of (d); (f) SEM morphology of the cross-section of the YB2C2 sample after quenching at 1300°C.