Figures & data
Figure 1: Relationship (over Groups N, OW and O) between BMI and total TBM, ABM, FFM (according to formulae by Janmahasatian et al.Citation8), TBM Total body mass; ABM adjusted body mass; Fat free mass; Mass of fat = TBM – FFM
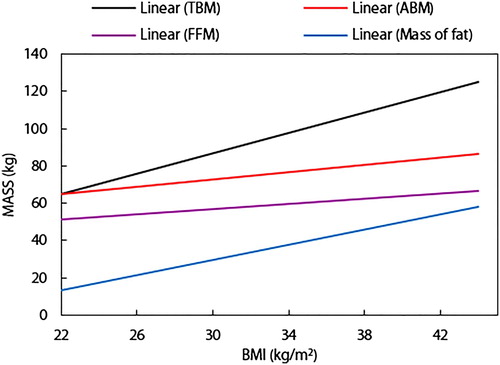
Table 1: Biographical variables
Figure 2: Propofol dose per total body mass. TBM Total body mass; 1 = Group N, 2 = Group OW, and 3 = Group O. Groups differed significantly (p < 0.0001).
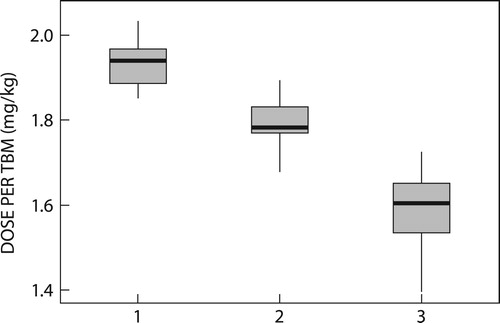
Table 2: Propofol dose per total body mass (mg/kg) and entropy
Figure 3: Lowest SE after induction. 1 Group N, 2 Group OW, and 3 Group O Groups did not differ significantly (p = 0.6480). ‘*’ are extreme values and ‘o’ are probably outliers.
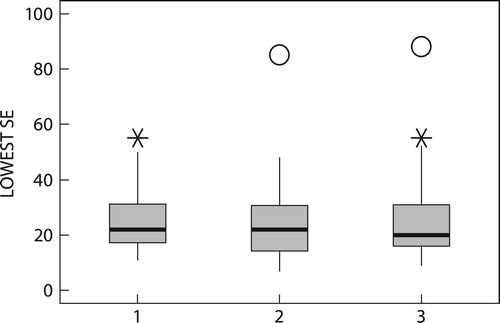
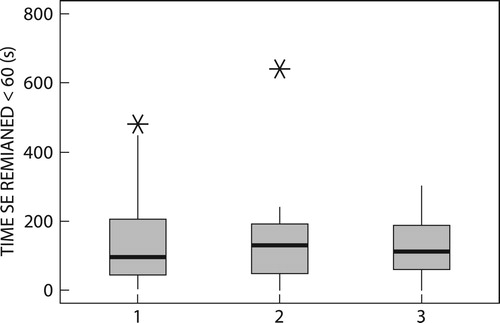
Figure 4: Duration of SE2 < 60. 1 Group N, 2 Group OW, and 3 Group O. Groups did not differ significantly (p = 1.0). ‘*’ are extreme values.