Figures & data
Figure 1. The antifungals itraconazole and posaconazole block IAV infection at non-cytotoxic concentrations. (A) Dose–response curve of itraconazole and posaconazole in A549 cells. Cells were treated with either DMSO, posaconazole (Posa) or itraconazole (Itra) for 16 h, and subsequently infected with IAV strain PR8M (MOI = 0.1). Virus titers were converted to percentages, posaconazole and itraconazole concentrations were log-transformed, and EC50 and EC90 values were calculated from the semi-logarithmic fitted curves. Data represent mean viral titers ± SEM of three independent experiments. (B) MTT assay of A549 cells treated with either the protein kinase inhibitor staurosporine (St), the solvent DMSO, itraconazole (Itra) or posaconazole (Posa) at the indicated concentrations for 24 h. Data represent means ± SEM, of eight independent experiments; one-way ANOVA with Dunnett’s multiple comparison tests, ****p ≤ 0.0001.
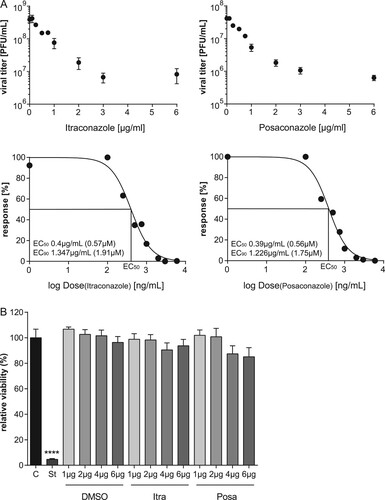
Figure 2. The antiviral activities are not subtype or cell line specific. A549, A431 cells or HUVECs were treated with either DMSO, posaconazole (Posa) or itraconazole (Itra) for 16 h, and subsequently infected with the indicated MOI of (A) IAV strain PR8M or (B) PAN for 24 h. (C) Postinfection treatment (2 h p.i.) of PR8M-infected A549 cells with either control, Itra or Posa. Data represent mean viral titers ± SEM, n = 5; one-way ANOVA with Dunnett’s multiple comparison tests, ****p ≤ 0.0001;***p ≤ 0.001; **p ≤ 0.01; *p ≤ 0.05.
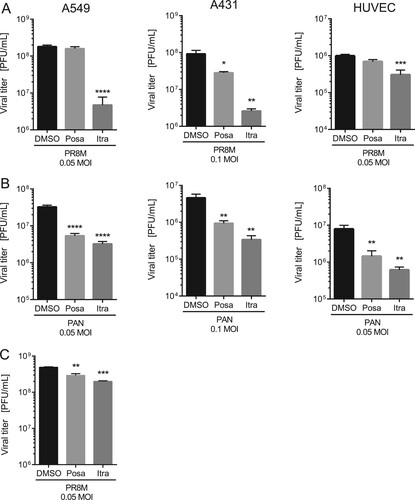
Figure 3. Itraconazole and posaconazole prime the IFN response. (A) PR8M and PAN virus titers upon posaconazole (Posa) and itraconazole (Itra) treatment of IFN-insensitive Vero cells. (B, C) qPCR analysis of the IFNs IFNα and IFNβ and the ISGs IFITM3 and MX1 in non-infected and (C) PR8M-infected A549 cells after 16 h treatment with either DMSO, itraconazole (Itra) or posaconazole (Posa). Samples were obtained from at least seven independent experiments and were run in triplicates. Expression levels of the genes of interest in the individual samples were normalized to GAPDH and ACTB. 2−ΔΔCt was used to calculate the fold change of relative gene expression compared to control. Graphs show drug-induced fold difference in the respective genes relative to control in the individual samples, with the mean fold change superimposed. Note that in (B), all samples were uninfected, whereas in (C), all samples were IAV-infected. Statistical significance of the differences was evaluated by one-way ANOVA with Dunnett’s multiple comparison tests on ΔΔCt values. ****p ≤ 0.0001; ***p ≤ 0.001; **p ≤ 0.01; *p ≤ 0.05.
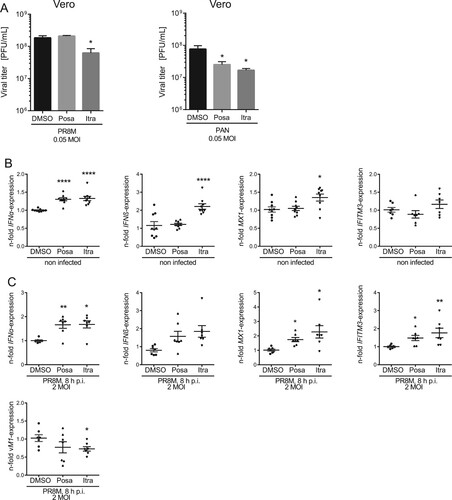
Figure 4. Itraconazole and posaconazole impair an early step in the IAV infection cycle. Cells pretreated with either the solvent DMSO, posaconazole (Posa), or itraconazole (Itra) for 16 h were infected with PR8M at the indicated MOI for 4 h. Bafilomycin A1 (Baf) served as a negative control. Nuclei were stained with DAPI, and infected cells were detected by nuclear vNP staining. Scale bar, 20 µm. To assess the percentages of successfully infected cells, the numbers of NP-positive nuclei were automatically quantified. Representative images are shown, and bar graphs represent the respective mean percentages ± SEM of NP-positive nuclei of >1000 infected cells. (A) A549 cells, three independent experiments, (B) Vero cells, Data represent means ± SEM n = 4. ****p ≤ 0.0001; ***p ≤ 0.001; **p ≤ 0.01; *p ≤ 0.05; one-way ANOVA followed by Dunnett’s multiple comparison test.
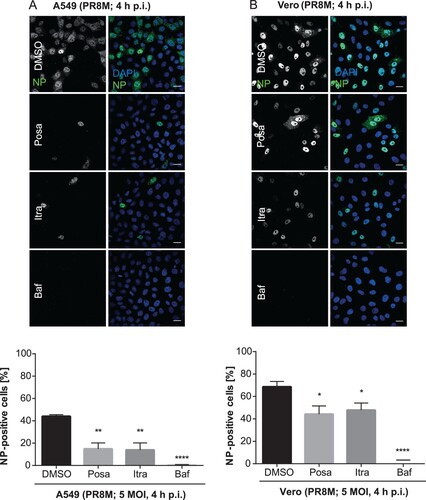
Figure 5. Itraconazole and posaconazole induce endolysosomal cholesterol storage without affecting endolysosomal acidification. (A) A549 cells treated for 16 h with either the solvent DMSO, posaconazole (Posa), or itraconazole (Itra) were stained for the LE/L marker protein CD63. Unesterified cellular cholesterol was visualized using filipin. DRAQ5 was used to label nuclei. Note that the digital images were pseudocolored. Scale bar, 20 µm. Colocalization coefficients of CD63 signals with filipin were quantitated from z-stacks. Bar graphs represent means ± SEM calculated from 20 individual cells per condition from two independent experiments. (B) A549 cells were treated as indicated for 16 h. Endosomal/lysosomal pH was measured by ratio imaging. pH values are means ± SEM of 30 cells for each condition from five independent experiments. (C) Cholesterol levels in cells treated with the solvent DMSO, posaconazole (Posa), or itraconazole (Itra). Data are expressed as mean cholesterol concentrations (in micrograms per millilitre) ± SEM from four independent experiments. ****p ≤ 0.0001; one-way ANOVA followed by Dunnett’s multiple comparison test.
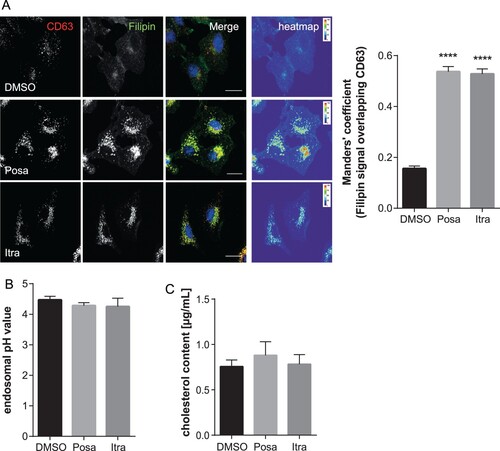
Figure 6. Effects of itraconazole and posaconazole on IAV infectivity under acidic bypass conditions. Cells were pretreated with either the solvent DMSO, posaconazole (Posa) or itraconazole (Itra) for 16 h, and were infected with IAV (PR8M, 20 MOI, 8 h) in the presence of Bafilomycin A1 under acidic bypass conditions. Non-infected cells and infection without acidic bypass in the presence of Bafilomycin A1 served as controls. NP-positive cells were detected by FACS (5,000 cells per sample). Data obtained in (A) A549 cells and (B) Vero cells are expressed as the median percentages ± SEM n = 5. ****, p ≤ 0.0001, two-way ANOVA with by Dunnett’s multiple comparison test.
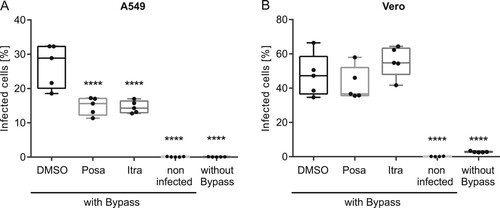
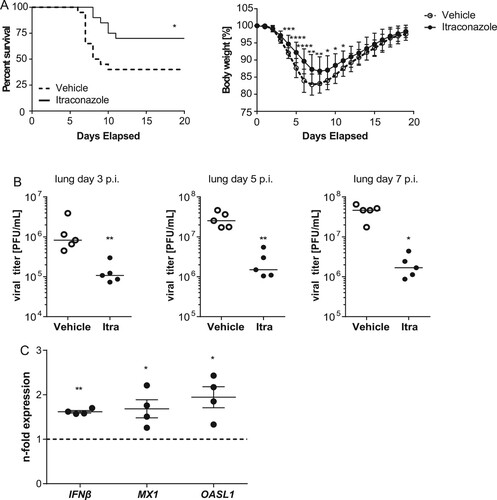
Figure 7. Itraconazole treatment restricts progression of IAV infection in mice. Eight-to-ten weeks-old male mice were treated intragastrically with itraconazole (70 mg/kg body weight) diluted in propylene glycol hydroxypropyl-β-cyclodextrine (Itra, solid line). Control animals received the equivalent volume of the solvent (vehicle, dotted line). Mice were infected intranasally with 500 pfu of the IAV H1N1 strain PR8M. (A) Cumulative survival rate and loss of liveweight plotted against days post infection. Mortality also includes mice that were euthanized because of a body weight loss of ≥20%. n = 20 mice/group, Mantel-Cox log rank test, p = 0.0136 or Mann–Whitney U-test. (B) Viral loads in lungs of the individual mice at indicated times post infection. (C) qPCR analysis of IFNβ and the ISGs MX1and OASL1 in lung homogenates of non-infected mice treated with either vehicle (control) or itraconazole. Samples were obtained from four individuals per group and were run in triplicates. Expression levels of the genes of interest in the individual samples were normalized to GAPDH and CYCS. 2−ΔΔCt was used to calculate the drug-induced fold change of relative gene expression compared to control animals. Graphs show difference in the respective genes in individual drug-treated animals relative to control, with the mean fold change ± SEM superimposed. Statistical significance of the differences was evaluated by unpaired student t-test on ΔΔCt values. *p < 0.1, **p < 0.01, ***p < 0.001, ****p < 0.0001.