
Figures & data
Figure 1. Immunization with a wP vaccine promotes formation of CD69+CD4+ TRM cells in the nose and lungs and prevents nasal colonization. C57BL/6 mice were immunized with 1/50 human dose of aP (Boostrix) or wP (NIBSC) twice (-6 and -2 weeks) before aerosol challenge with B. pertussis. (a) CFUs in the lungs and nose were enumerated at indicated time points. Lung and nose CFU counts (mean ± SEM n = 8 mice per group per time-point in two independent experiments). **p < .01, ****p < .0001 versus aP by two-way ANOVA with the Tukey’s post-test. (b) On the day of but prior to B. pertussis challenge spleen cells were stimulated with FHA or sonicated B. pertussis (sBp) or medium only and IFN-γ, IL-17 and IL-5 concentrations in supernatants were quantified by ELISA after 3 days of culture. Results shown are mean ± SEM (n = 4 mice in triplicate). *p < .05, ***p < .001, ****p < .0001 versus aP by one-way ANOVA with the Tukey’s post-test, only significant differences between experimental groups are indicated. (c–e) Seven days post challenge, mice were injected i.v. with anti-CD45 Ab 10 min prior to euthanasia to discriminate circulating from tissue-resident leukocytes by flow cytometry. (c) Total number of CD4 T cells in the lungs (upper graph) and nasal cavity (lower graph). (d) Total number of CD45iv–CD44+CD62L–CD69+CD4+ TRM cells in the lungs and nasal cavity. Results (c and d) are mean ± SEM (n = 8 mice in two independent experiments) *p < .05, **p < .01, ****p < .0001 versus aP by one-way ANOVA with the Tukey’s post-test, only significant differences between experimental groups are indicated. (e) Representative plots for expression of CD69 and CD103 on CD45iv–CD44+CD62L–CD4+ T cells.
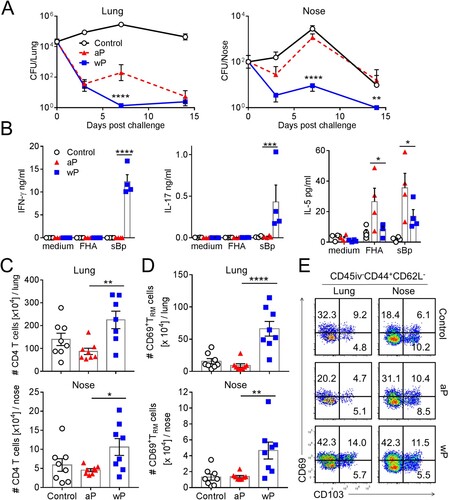
Figure 2. CD4 T cells in the lung and nasal tissue of mice immunized with a wP vaccine and challenged with B. pertussis potently secreted IFN-γ and IL-17. C57BL/6 mice were immunized and challenged, and tissue-resident cells were quantified as described in . Intracellular cytokine staining and flow cytometry were performed on lung and nasal tissue T cells one day before (D0) and 7 days post challenge (D7). Representative plots showing IFN-γ and IL-17 secretion by lung (a) and nasal tissue (c) CD4 T cells. Total number of IFN-γ- and IL-17-secreting lung and nasal CD45iv–CD4 T cells in the lungs (b) and nasal tissue (d). Results shown are mean ± SEM (n = 8 in two independent experiments). ***p < .001, ****p < .0001 versus aP by two-way ANOVA with the Tukey’s post-test, only significant differences between experimental groups are indicated. (e) Tissue-resident CD45iv–CD4+ T cells purified from the lungs 2 weeks post immunization (prior to B. pertussis challenge) were stimulated with sonicated B. pertussis (sBp) in the presence of irradiated splenic APC. After 3 days of culture, IFN-γ and IL-17 was quantified in supernatants by ELISA. Results shown are mean ± SD for triplicate culture of cells pooled from 4 mice per group.
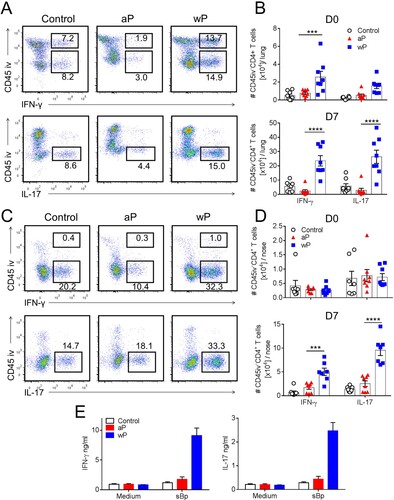
Figure 3. CD69+CD4+ TRM cells induced in the lungs and nasal tissue by immunization with a wP vaccine potently secreted IFN-γ and IL-17. C57BL/6 mice were immunized and challenged, and tissue-resident cells were quantified as described in . Representative FACS plots and total number of IFN-γ- and IL-17-secreting CD69+CD4+ TRM cells in the lungs (a) and nasal cavity (b) 7 days post challenge. (c, d) Absolute numbers of IFN-γ or IL-17-producing CD69+CD4+ TRM cells in the lung (c) or nasal tissue (b). Results shown are mean ± SEM (n = 8 mice in two independent experiments). ****p < .0001 versus aP by two-way ANOVA with the Tukey’s post-test, only significant differences between experimental groups are indicated.
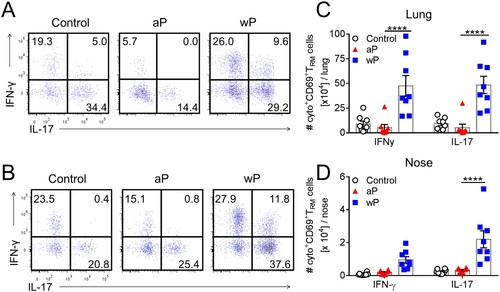
Figure 4. Sustained protective immunity against nasal colonization induced by previous infection or immunization with a wP vaccine correlates with the induction of TRM cells. (a) Schematic of immunization and challenge protocol. C57BL/6 mice were either aerosol infected with B. pertussis (conv), or immunized with 1/50 human dose of aP (Boostrix) or wP (NIBSC) twice at an interval of 4 weeks. Seven months after clearance of primary infection or after the 2nd immunization, the animals were aerosol challenged with B. pertussis. (b) CFUs in lung and nasal tissue homogenates were determined 3, 7, and 14 days post challenge. Results are mean ± SEM n = 4 mice per group per time-point. *p < .05, ***p < .001 aP versus wP; #p < .05, ##p < .01, ####p < .0001 wP versus conv; ++p < .01, +++p < .001, ++++p < .0001 aP versus conv by two-way ANOVA with the Tukey’s post-test. (c) Seven days post challenge, lymphocytes from the lungs and nasal tissue were prepared by digestion. Prior to euthanasia, the animals were i.v. injected with fluorochrome-coupled CD45 antibody to allow the discrimination of tissue-resident and circulating cells. Results are mean ± SEM (n = 4 mice) absolute numbers of CD69+CD4+ TRM cells (left graphs), IFN-γ-producing CD69+ CD4+ TRM cells (middle graphs) and IL-17-producing CD69+CD4+ TRM cells (right graphs) in the lung (top) or nasal tissue (bottom). *p < .05, **p < .01, ***p < .001 by one-way ANOVA with the Tukey’s post-test, only significant differences between experimental groups are indicated. (d) Representative plots showing secretion of IFN-γ and IL-17 by CD45iv–CD44+CD62L–CD69+CD4+ T cells. (e) Correlation between protection against nasal colonization and the absolute number of IL-17-producing CD69+CD4+ TRM cells in that tissue for the corresponding mouse. Protection was expressed as a ratio of the area under the curve (AUC) of bacterial clearance (day 0–14) after challenge of immunized versus the AUC for control unimmunized mice, as previously described [Citation45]. Dotted lines indicate 95% confidence bands of the best fit line.
![Figure 4. Sustained protective immunity against nasal colonization induced by previous infection or immunization with a wP vaccine correlates with the induction of TRM cells. (a) Schematic of immunization and challenge protocol. C57BL/6 mice were either aerosol infected with B. pertussis (conv), or immunized with 1/50 human dose of aP (Boostrix) or wP (NIBSC) twice at an interval of 4 weeks. Seven months after clearance of primary infection or after the 2nd immunization, the animals were aerosol challenged with B. pertussis. (b) CFUs in lung and nasal tissue homogenates were determined 3, 7, and 14 days post challenge. Results are mean ± SEM n = 4 mice per group per time-point. *p < .05, ***p < .001 aP versus wP; #p < .05, ##p < .01, ####p < .0001 wP versus conv; ++p < .01, +++p < .001, ++++p < .0001 aP versus conv by two-way ANOVA with the Tukey’s post-test. (c) Seven days post challenge, lymphocytes from the lungs and nasal tissue were prepared by digestion. Prior to euthanasia, the animals were i.v. injected with fluorochrome-coupled CD45 antibody to allow the discrimination of tissue-resident and circulating cells. Results are mean ± SEM (n = 4 mice) absolute numbers of CD69+CD4+ TRM cells (left graphs), IFN-γ-producing CD69+ CD4+ TRM cells (middle graphs) and IL-17-producing CD69+CD4+ TRM cells (right graphs) in the lung (top) or nasal tissue (bottom). *p < .05, **p < .01, ***p < .001 by one-way ANOVA with the Tukey’s post-test, only significant differences between experimental groups are indicated. (d) Representative plots showing secretion of IFN-γ and IL-17 by CD45iv–CD44+CD62L–CD69+CD4+ T cells. (e) Correlation between protection against nasal colonization and the absolute number of IL-17-producing CD69+CD4+ TRM cells in that tissue for the corresponding mouse. Protection was expressed as a ratio of the area under the curve (AUC) of bacterial clearance (day 0–14) after challenge of immunized versus the AUC for control unimmunized mice, as previously described [Citation45]. Dotted lines indicate 95% confidence bands of the best fit line.](/cms/asset/997b5ee6-5dde-4da5-9dac-6dea836fc24c/temi_a_1564630_f0004_oc.jpg)
Figure 5. Preventing lymphocyte migration from lymph nodes during wP immunization suppresses accumulation of CD4 TRM cells in the lungs and impairs protection. (a) Schematic of experimental plan; C57BL/6 mice were immunized with a wP vaccine 6 and 2 weeks before challenge with B. pertussis. wP-immunized mice were given FTY720 in the drinking water during the immunization phase (3 days before 1st immunization until 7 days after 2nd immunization) or during infection (6 days before B. pertussis challenge and during infection). (b) CFU counts in the lungs at intervals after aerosol challenge with B. pertussis. Lung CFU counts (left graph: mean ± SEM n = 8 mice per group per time-point in two independent experiments; right graph: mean ± SEM n = 4 mice per group per time-point). **p < .01 versus wP + FTY720 by two-way ANOVA with the Tukey’s post-test, only significant differences between experimental groups are indicated. Seven days post challenge, mice were injected i.v. with anti-CD45 antibody 10 min prior to euthanasia to discriminate circulating from tissue-resident leukocytes by flow cytometry. (c) Total number of CD69+CD4+ TRM cells. Results shown are mean ± SEM (left graph: n = 8 mice in two independent experiments; right graph: n = 4 mice). **p < .01 versus wP + FTY720 by one-way ANOVA with the Tukey’s post-test. (d) Total number of IFN-γ- and IL-17-secreting CD69+CD4+ TRM cells in the lungs with representative plots showing secretion of IFN-γ and IL-17 by CD45iv–CD44+CD62L–CD69+CD4+ T cells in wP-immunized mice treated with FTY720 during the immunization phase. Results shown are mean ± SEM (n = 8 mice in two independent experiments). ***p < .001 versus wP + FTY720 by two-way ANOVA with the Tukey’s post-test.
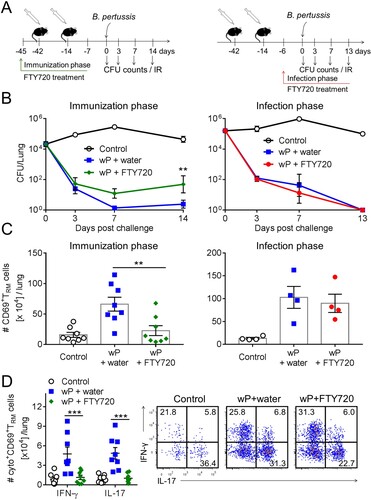
Figure 6. CD69+CD4+ TRM cells that secrete IFN-γ and IL-17 accumulate in the lungs and reduce bacterial burden in naïve recipient mice after transfer from wP-immunized mice. C57BL/6 mice were immunized with aP and wP vaccines at 6 and 2 weeks or were challenged with B. pertussis 7 weeks before euthanasia. Anti-CD45 Ab was administered i.v. 10 min. prior to euthanasia to discriminate circulating from lung resident leukocytes. CD45iv–CD4+ T cells were purified from the lungs of wP-immunized or convalescent mice and CD4+ T cells from the spleens of aP- or wP-immunized or naive control mice. 2 × 10⁵ lung and 4 × 10⁵ spleen CD4 T cells were adoptively transferred to naïve irradiated mice one day prior to aerosol challenged with B. pertussis. (a) CFUs in the lungs were enumerated at day 13 post challenge. Results shown are mean ± SEM (n = 3 mice). *p < .05; ****p < .0001 by one-way ANOVA with the Tukey’s post-test. (b) Total number of CD69+CD4+ TRM cells in the lungs at day 13 post challenge (c) Flow cytometry analysis showing representative plots of CD69 and CD103 expression on CD45iv–CD44+CD62L–CD4+ T cells and IFN-γ and IL-17 secretion by CD45iv–CD44+CD62L–CD69+CD4+ TRM cells and (d) total number of IFN-γ- and IL-17-secreting CD69+CD4+ TRM cells in the lungs at day 13 post challenge. Results shown are mean ± SEM (n = 3 mice). ****p < .0001 by one-way ANOVA with the Tukey’s post-test.
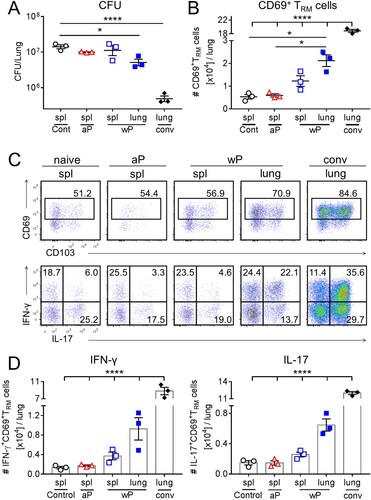
Figure 7. Respiratory CD4 TRM correlate with protection against nasal colonization with B. pertussis. (a) Schematic of immunization and challenge protocol. C57BL/6 mice were either aerosol infected with B. pertussis (conv), or immunized with 2 doses of either aP (Infanrix) or wP (Shan 5) at an interval of 4 weeks. 9 weeks after challenge and 4 weeks after the second immunization, mice were aerosol challenged with B. pertussis. (b) CFUs in lung homogenates and nasal washes were determined 3, 7, and 14 days post challenge. Results are mean ± SEM n = 4 mice per group per time-point. *p < .05 aP versus wP; ##p < .01 wP versus conv; +p < .05, +++p < .001 aP versus conv by two-way ANOVA with the Tukey’s post-test. One day before challenge (pre) and 7 days post challenge (d7) lymphocytes from the three right lobes of the lung and nasal tissue were prepared by digest. Prior to euthanasia, the animals were i.v. injected with fluorochrome-coupled CD45 antibody to allow the discrimination of tissue-resident and circulating cells. (c) Absolute numbers of CD69+CD4+ TRM cells in the lung or nasal tissue. (d) Absolute numbers of IL-17-producing CD69+CD4+ TRM cells in the lung or nasal tissue. Results shown are mean ± SEM (n = 4 mice). One-way ANOVA for immunized groups, *p < .05, ***p < .001, only significant differences in comparison to aP are indicated. (e) Correlation between protection against nasal colonization and the absolute number of IFN-γ- or IL-17-producing CD69+CD4+ TRM in the nasal tissue for the corresponding mouse. Protection was expressed as a ratio of the area under the curve (AUC) of bacterial clearance (day 0–14) after challenge of immunized or previously infected versus the AUC for control unimmunized mice, as previously described [Citation45]. Dotted lines indicate 95% confidence bands of the best fit line. N = 4 mice/group at each time point.
![Figure 7. Respiratory CD4 TRM correlate with protection against nasal colonization with B. pertussis. (a) Schematic of immunization and challenge protocol. C57BL/6 mice were either aerosol infected with B. pertussis (conv), or immunized with 2 doses of either aP (Infanrix) or wP (Shan 5) at an interval of 4 weeks. 9 weeks after challenge and 4 weeks after the second immunization, mice were aerosol challenged with B. pertussis. (b) CFUs in lung homogenates and nasal washes were determined 3, 7, and 14 days post challenge. Results are mean ± SEM n = 4 mice per group per time-point. *p < .05 aP versus wP; ##p < .01 wP versus conv; +p < .05, +++p < .001 aP versus conv by two-way ANOVA with the Tukey’s post-test. One day before challenge (pre) and 7 days post challenge (d7) lymphocytes from the three right lobes of the lung and nasal tissue were prepared by digest. Prior to euthanasia, the animals were i.v. injected with fluorochrome-coupled CD45 antibody to allow the discrimination of tissue-resident and circulating cells. (c) Absolute numbers of CD69+CD4+ TRM cells in the lung or nasal tissue. (d) Absolute numbers of IL-17-producing CD69+CD4+ TRM cells in the lung or nasal tissue. Results shown are mean ± SEM (n = 4 mice). One-way ANOVA for immunized groups, *p < .05, ***p < .001, only significant differences in comparison to aP are indicated. (e) Correlation between protection against nasal colonization and the absolute number of IFN-γ- or IL-17-producing CD69+CD4+ TRM in the nasal tissue for the corresponding mouse. Protection was expressed as a ratio of the area under the curve (AUC) of bacterial clearance (day 0–14) after challenge of immunized or previously infected versus the AUC for control unimmunized mice, as previously described [Citation45]. Dotted lines indicate 95% confidence bands of the best fit line. N = 4 mice/group at each time point.](/cms/asset/9be4a920-91f7-473a-8073-01c95dc13ede/temi_a_1564630_f0007_oc.jpg)