Figures & data
Figure 1. Map of poultry and human sampling sites in Cameroon. Sites where sampling took place for avian influenza prevalence and exposure are indicated on the map of Cameroon in central Africa. Blue squares represent poultry sampling locations. Red stars indicate human sampling locations.
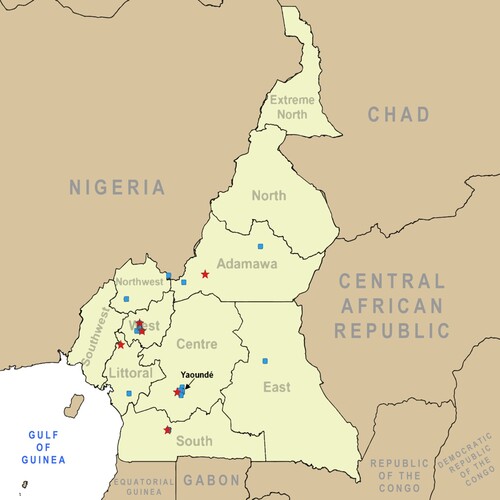
Table 1. Number and percentage of influenza A(H5N1) positive samples identified in poultry in Cameroon between May and June 2016.
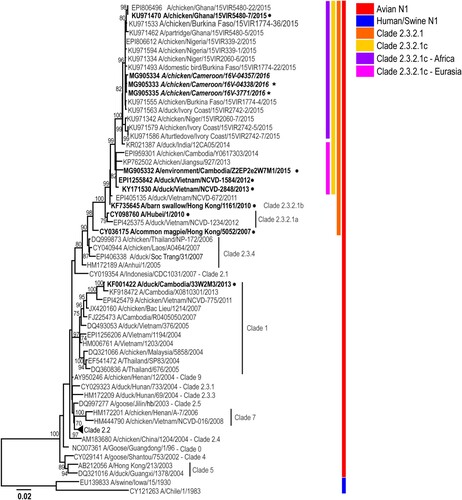
Figure 2. Phylogenetic analysis of the A(H5N1) haemagglutinin (HA) genes from representative viruses from Cameroon (A). The phylogenetic tree was generated using the maximum-likelihood method. Bootstrap values (n = 500) > 70 are shown. Scale bars indicate substitutions per site. Sequences from representative Cameroonian strains included in the study are indicated in bold and italic. Other control strains are indicated in bold. Representative Cameroonian isolates used in the study for antigenic analysis are indicated with black stars while control strains are indicated with black circles. Amino acid differences determined in representative strains as compared to other clade 2.3.2.1c HA genes are indicated in red on the model (B). Positions are stated under H5 numbering.
Figure 3. Phylogenetic analysis of the A(H5N1) neuraminidase (NA) genes from representative viruses from Cameroon. The phylogenetic tree was generated using the maximum-likelihood method. Bootstrap values (n = 500) > 70 are shown. Scale bars indicate substitutions per site. Sequences from representative Cameroonian strains included in the study are indicated in bold and italic. Other control strains are indicated in bold. Representative Cameroonian isolates used for antigenic analysis are indicated with black stars while control strains are indicated with black circles.