
Figures & data
Figure 1. Outline of experimental scheme in this study. M. tuberculosis H37Rv strain was cultured on Löwenstein-Jensen (LJ) medium and processed by amplification culture named as passage 0 (P0) strains, which were selected for preparing PAS-resistant strains. Concentration gradients (2−4, 2−3, 2−2, 2−1, 20) of PAS based on the critical concentration (1.0 mg/L PAS) contained LJ medium were prepared, and P0 strains (1 MCF) were cultured in LJ medium (2−4 PAS concentration) for approximately 4 weeks named as passage 1 (P1). Repeat this step till passage 4 (P5) strains, which met to the WHO criteria for PAS-resistant strains, and then the resistant strains were verified by the appropriate concentrations of drug used in the drug-susceptibility test. The resistant strains were continuously cultured to passage 8 (P8) without PAS, and then analysed by the drug-susceptibility test. 218 single colonies were randomly selected and cultured in liquid culture for the extraction of genomic DNA and testing PAS MICs of Mtb strains. Then single colonies were assessed by targeted sequencing of PCR amplicons of genes associated with PAS resistance. The primers used in the targeted sequencing are described in Supplemental Table S8. Two strains, one folC mutant and one non-folC mutant are identified and subjected to full genome resequencing, proteomic and metabolomic analysis.
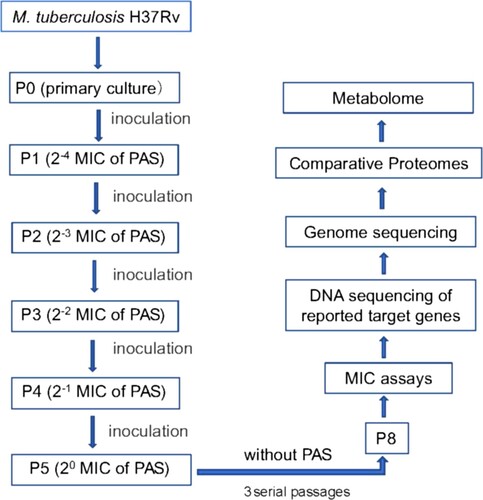
Figure 2. Characterization of PAS-resistant Mtb used in this study. (A) Growth of M. tuberculosis H37Rv, PASr 1 and PASr 2 strains in 7H9 + ADC liquid media for 37 days. The average of two biological replicates is shown. (B) Phenotypic analysis of M. tuberculosis strains. Wild-type strain (control) was compared to folC mutated PASr strains (PASr1) and folC unmutated PASr strains (PASr2) for the following phenotypes: (a) Colony morphology, (b) Sliding motility. (C) IGR SNPs alter the expression level of downstream genes. Two IGRs on the expression of lacZ in M. smegmatis were examined by performing β-D-galactosidase activity assays on IGR-lacZ constructs. The IGR sequences, with or without the SNPs (3074495 G→A, located in between thyA and Rv2765 and 3633617 C→T, located in between Rv3253c and Rv3254) identified in this study, were inserted into the pSD5B mycobacterial shutter vector that contains a promoterless lacZ reporter gene immediately downstream of the cloning site and β-D-galactosidase activity was assayed. Error bars represent the s.d. calculated from three separate measurements. (D) Semi-quantitative RT-PCR was used to examine the expression of the IGR downstream genes. thyA, drfA and hsdS are located in the downstream of 3074495 SNP, Rv3253c is located in in the downstream of 3633617 SNP and lpdA, glpD2, Rv3304, amiA1, amiB1 are located in the downstream of VNTR 3690 locus. Data were analysed using the ΔΔCT method with the M. tuberculosis reference gene sigA as the control. Data were mean values ± SD from independent biological samples. ** represents P value < 0.01. (E) iTRAQ was used to examine the expression of the IGR downstream genes in PASr2 Mtb. * represents P value < 0.05. (F) SAM-dependent methyltransferases (AdoMet-MT) and some folic acid synthesis-related proteins with significant differences were identified by iTRAQ in PASr1 Mtb compared to the parental strain. * represents P value < 0.05.
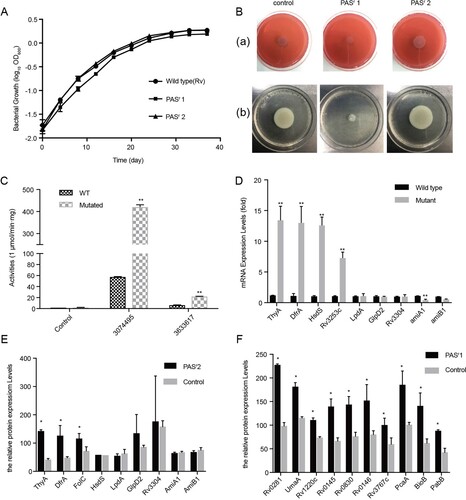
Figure 3. Gene Ontology categories for the differentially expressed proteins in PASr1 strain compared with those in its parent strain using DAVID analysis. (A) Functional classification of the differentially expressed proteins in the cellular component that increased and decreased, respectively. (B) Functional classification of the differentially expressed proteins in the biological processes that increased and decreased, respectively. (C) Functional classification of the differentially expressed proteins in the molecular functions that increased and decreased, respectively.
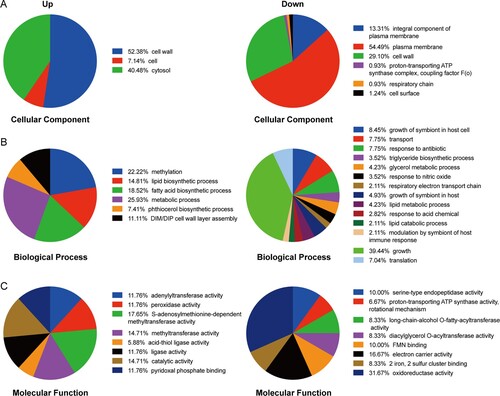
Figure 4. Histogram displaying KEGG pathway of the differentially expressed proteins in PASr 1 strain according to the P value. (A) The upregulated and downregulated pathway were marked. Each related gene numbers is shown on the right of the bars. (B) Heat map showing the average expression level of proteins related to phenylalanine metabolism in in PASr1 Mtb compared to its parental strain.
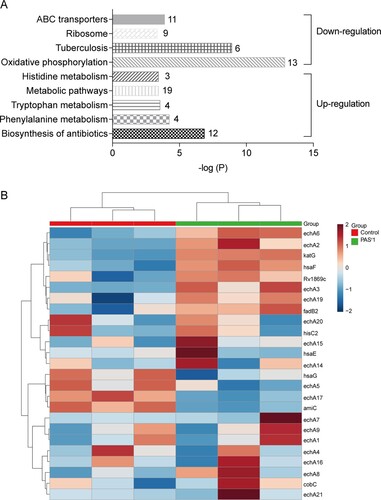
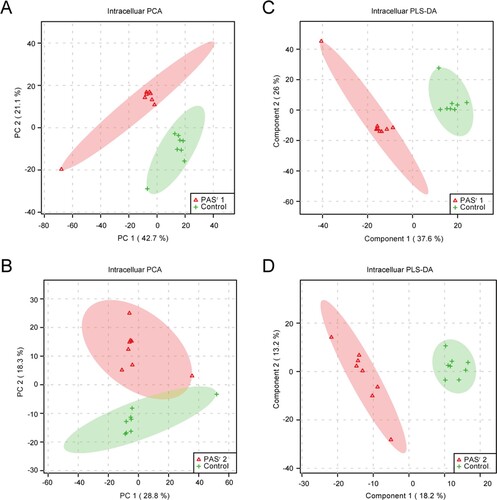
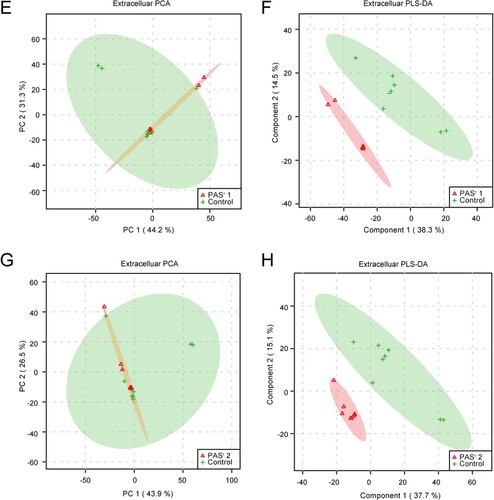
Figure 6. The significantly alterated metabolites related to phenylalanine metabolism pathways were observed in intracellular and extracelluar metabolites of PASr Mtb strains. (A) The intracellular metabolites in PASr 1 Mtb strain. (B) The intracellular metabolites in PASr 2 Mtb strain. (C) The extracellular metabolites in PASr 1 Mtb strain. (D) A schematic summary of the metabolic and proteomic changes involved in phenylalanine metabolism in PASr Mtb strains. The purple characters represent the different metabolites found in the PASr Mtb strain. The red arrows indicate significantly increased proteins, while the green arrows indicate significantly decreased proteins in PASr 1 Mtb strain compared to its parental strain.
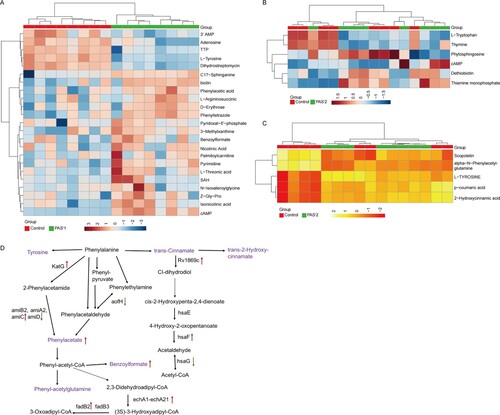
Figure 7. Mechanisms of PAS resistance in this study. Three characterized mechanisms relative to this study are shown. (A) Reduce PAS uptake. The PAS uptake is reduced in PASr1 strain via the decreasing membrane proteins, especially ABC transporters. (B) Repress bioactivation of PAS. PASr1 strain can diminish bioactivation of PAS by increasing the abundance of SAM-dependent methyltranferases and FolC mutation. (C) Overexpression of DfrA and ingesting exogenous methionine. In PASr2 strain, inhibition of dihydrofolate reduction can be negated by DfrA overexpression and exogenous methionine uptake. Blue dashed doxes represent PASr1 and red dashed dox represent PASr2 strain.
Data availability
The datasets generated during and/or analysed during the current study are available from the corresponding authors upon request.