3,321
Views
22
CrossRef citations to date
0
Altmetric
Articles

Genetic diversity and host adaptation of avian H5N1 influenza viruses during human infection

ORCID Icon, , , , , , ORCID Icon, ORCID Icon, , ORCID Icon, ORCID Icon & ORCID Icon show all
Pages 262-271 | Received 07 Nov 2018, Accepted 01 Feb 2019, Published online: 17 Feb 2019

Figures & data

Figure 1. Mean minority proportion across the genome in the course of human H5N1. The mean minority proportion (MMP) is defined as the percentage of non-consensus reads per genomic position, averaged across all specimens.

Figure 1. Mean minority proportion across the genome in the course of human H5N1. The mean minority proportion (MMP) is defined as the percentage of non-consensus reads per genomic position, averaged across all specimens.

Table 1. Amino acid residues at positions implicated in airborne transmission of H5N1 viruses [Citation5,Citation6,Citation18].

Figure 2. Prevalence of variants observed during human infection in publicly available sequences from avian (x-axis) and human (y-axis) H5N1 isolates from Indonesia. Each variant, defined as a unique combination of position and amino acid, is represented by a dot. (A) Prevalence of variants per viral segment. Each of the 5608 variants detected in respiratory specimens from 44 H5N1-infected patients is represented by a dot, where the colour indicates the gene in which the variant was located; (B) As (A), but displaying the percentage of samples in which the variant was detected, indicated by dot size, and the average proportion at which the variant was present within these samples, indicated by dot colour: a large red dot represents a variant that is found in many samples, at a high proportion in those samples.
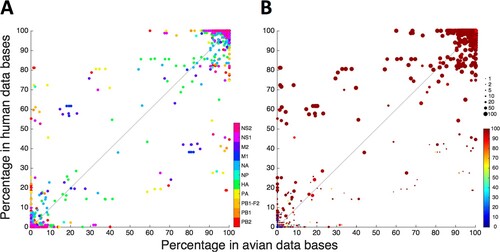
Figure 2. Prevalence of variants observed during human infection in publicly available sequences from avian (x-axis) and human (y-axis) H5N1 isolates from Indonesia. Each variant, defined as a unique combination of position and amino acid, is represented by a dot. (A) Prevalence of variants per viral segment. Each of the 5608 variants detected in respiratory specimens from 44 H5N1-infected patients is represented by a dot, where the colour indicates the gene in which the variant was located; (B) As (A), but displaying the percentage of samples in which the variant was detected, indicated by dot size, and the average proportion at which the variant was present within these samples, indicated by dot colour: a large red dot represents a variant that is found in many samples, at a high proportion in those samples.

Figure 3. Variants not previously reported in H5N1 virus. Gene position of variants and average proportion at which these were detected within specimens are represented of 467 variants observed in patient specimens that have not been reported in publicly available sequences of avian or human H5N1 isolates. The symbol colour indicates the number of samples in which a variant was detected.

Figure 3. Variants not previously reported in H5N1 virus. Gene position of variants and average proportion at which these were detected within specimens are represented of 467 variants observed in patient specimens that have not been reported in publicly available sequences of avian or human H5N1 isolates. The symbol colour indicates the number of samples in which a variant was detected.

Figure 4. Proportional increase of variants during course of infection. Represented are 499 variants observed in sequential specimens from 8 patients, depicted per gene segment, that increased by at least 1% over 1–2 days. Initial sample was collected after a median of 8.5 days (range: 5–10) after onset of symptoms. Each line represents a single amino acid variant.
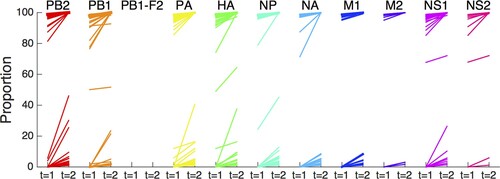
Figure 4. Proportional increase of variants during course of infection. Represented are 499 variants observed in sequential specimens from 8 patients, depicted per gene segment, that increased by at least 1% over 1–2 days. Initial sample was collected after a median of 8.5 days (range: 5–10) after onset of symptoms. Each line represents a single amino acid variant.

Figure 5. Polymerase activity of avian H5N1 influenza virus containing substitutions appearing during human infection. A mini-replicon assays was performed to screen for possible human adaptive changes within the polymerase complex/. Plasmids encoding for the PB2, PB1, PA and NP gene of avian H5N1 strain A/chicken/Indonesia/BL/2003 were co-transfected into human HEK293 T cells with a plasmid encoding for a vRNA consisting of the firefly luciferase flanked by the non-coding regions of influenza A virus NS1. Luciferase activity was measured 24 h post-transfection and incubation at 37°C. The activity of the luciferase was normalized using a control plasmid expressing the Renilla luciferase. Polymerase activity of wild type was set to one and depicted in white and human adaptive substitution PB2-E627 K is depicted in gray. Polymerase complexes containing substitutions in PB2, PB1 and PA are depicted in panels (A), (B) and (C) respectively.
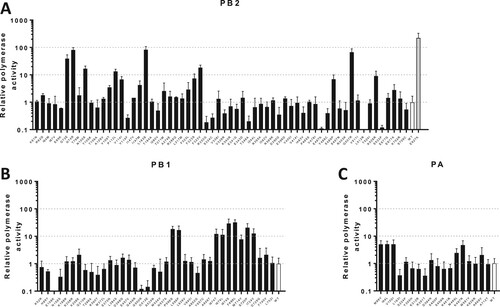
Figure 5. Polymerase activity of avian H5N1 influenza virus containing substitutions appearing during human infection. A mini-replicon assays was performed to screen for possible human adaptive changes within the polymerase complex/. Plasmids encoding for the PB2, PB1, PA and NP gene of avian H5N1 strain A/chicken/Indonesia/BL/2003 were co-transfected into human HEK293 T cells with a plasmid encoding for a vRNA consisting of the firefly luciferase flanked by the non-coding regions of influenza A virus NS1. Luciferase activity was measured 24 h post-transfection and incubation at 37°C. The activity of the luciferase was normalized using a control plasmid expressing the Renilla luciferase. Polymerase activity of wild type was set to one and depicted in white and human adaptive substitution PB2-E627 K is depicted in gray. Polymerase complexes containing substitutions in PB2, PB1 and PA are depicted in panels (A), (B) and (C) respectively.

Figure 6. Position of polymerase complex substitutions that show large effects on polymerase activity in human cells. (A) Location of all substitutions showing an increase in polymerase activity of over 5 fold are shown of the molecular structure of the influenza A polymerase complex (PDB 4WSB). The substitutions that resulted in substantial activity increases can be divided into two groups: (1) sites on the complex surface (PB2-L183S, G74R, PB2-Q507R, PB2-F323 V, PB1-P596S, PB1-L598P, PB2-K526R, PA-L336M) and (2) sites at subunit interfaces: PB1 C-terminus and PA endonuclease domains (PB1-720, PB1-724, PA-94, PA-86) and the PB1 C-terminus and PB2 N-terminus domains (PB2-73, PB1-696, PB2-100, PB2-112, PB1-674) as shown in panel (B).
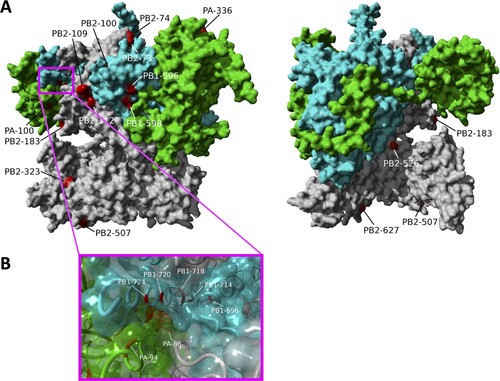
Figure 6. Position of polymerase complex substitutions that show large effects on polymerase activity in human cells. (A) Location of all substitutions showing an increase in polymerase activity of over 5 fold are shown of the molecular structure of the influenza A polymerase complex (PDB 4WSB). The substitutions that resulted in substantial activity increases can be divided into two groups: (1) sites on the complex surface (PB2-L183S, G74R, PB2-Q507R, PB2-F323 V, PB1-P596S, PB1-L598P, PB2-K526R, PA-L336M) and (2) sites at subunit interfaces: PB1 C-terminus and PA endonuclease domains (PB1-720, PB1-724, PA-94, PA-86) and the PB1 C-terminus and PB2 N-terminus domains (PB2-73, PB1-696, PB2-100, PB2-112, PB1-674) as shown in panel (B).
Supplemental material

Supplemental Material

Download Zip (4.9 MB)