Figures & data
Figure 1. The ASFV-QP509L and Q706L RNA helicases are highly conserved among virulent and non-virulent isolates, sharing a distinct ancestor. (a) Phylogenetic analysis of ASFV RNA helicases. Maximum-likelihood phylogenetic tree constructed from a multiple nucleotide sequence alignment of ASFV-QP509L, Q706L, A859L, B962L, D1133L ORFs, using two different ASFV isolates (L60 – virulent and Ba71V – non-virulent). Sequence from a RNA helicase SF2 of Sus scrofa worked as outgroup. Bootstrap values are indicated. (b) Schematic representation of ASFV genome, including the localization of ASFV-QP509L and ASFV-Q706L. Relative positions of DEAD-box motifs, ATP-binding sites and sequence overlap (126 bp) are represented.
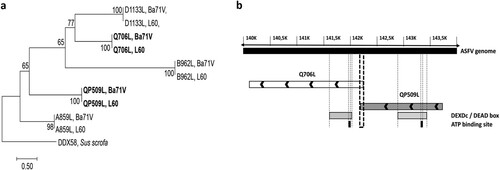
Figure 2. ASFV-QP509L and ASFV-Q706L RNA helicases show a similar genotype cluster segregation to ASFV-B646L, sharing the same monophyletic groups with other SF2 RNA helicases from NCLDV. (a) The maximum-likelihood phylogenetic tree was constructed from a multiple amino acid sequence alignment of ASFV-QP509L, using 13 different ASFV isolates. (b) Maximum-likelihood phylogenetic tree was constructed from a multiple amino acid sequence alignment of ASFV-Q706L, using 13 different ASFV isolates. Geographic distribution and genotype of ASFV isolates are also indicated. (c) Phylogenetic analysis of ASFV-QP509L, ASFV-Q706L and other viral Superfamily 2 (SF2) RNA helicases. The maximum-likelihood tree was generated from a multiple amino acid sequence alignment of ASFV-QP509L and ASFV-Q706L RNA helicases with other SF2 encoded by NCLDV members. The sequence of one SF2 RNA helicase of S. scrofa (DDX58) acted as outgroup. Bootstrap values are indicated.
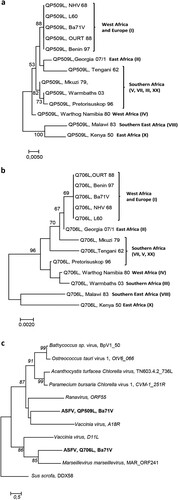
Figure 3. ASFV-QP509L and ASFV-Q706L are transcribed from early times of infection. (a) ASFV-QP509L transcripts were detected from 2 hpi, showing a maximum concentration peak at 12 hpi. (b) ASFV-Q706L transcripts were detected from early times of infection (2 hpi) reaching a maximum concentration at 10 hpi. (c, d) ASFV-CP204L and ASFV-B646L mRNA were used as controls. Results are shown as mean ± standard error of the number of transcripts of each viral gene normalized with Cyclophilin A mRNA levels (reference gene). Three independent experiments were performed in duplicate.
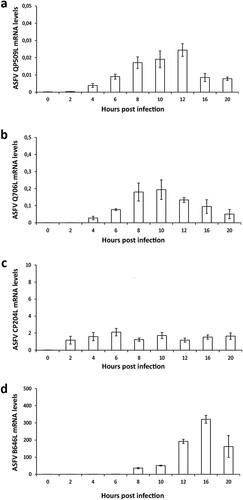
Figure 4. ASFV-pQP509L and ASFV-pQ706L are detected at late times of infection, showing distinct distribution patterns. (a) ASFV-pQP509L was detected at viral factories and host nucleus from 12 hpi onwards. (b) ASFV-pQ706L was identified only within viral factories and also after 12 hpi. Vero-infected cells (MOI = 2) were fixed (4, 8, 12, and 16 hpi), stained and analysed by fluorescence microscopy. In the merged images, ASFV-pQP509L and ASFV-pQ706L were labelled in green, infected cells in red and DNA in blue (DAPI staining). Representative images of at least three independent experiments are shown. (c) Immunoblot analysis revealed that ASFV-pQ706L is a late protein, being absence in the presence of AraC. Vero cells infected with ASFV/Ba71V isolate (MOI of 5) were harvested at the indicated time points. The cytosine arabinoside exposure (AraC, 50 µg/ml) was performed after an initial viral adsorption period (1 h) and cells were collected at 20 hpi.
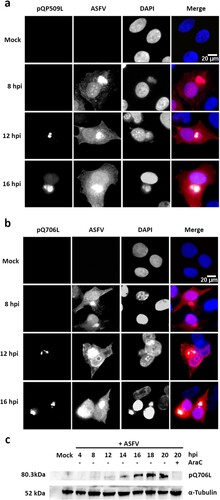
Figure 5. siRNAs targeting ASFV-QP509L and ASFV-Q706L transcripts disrupt late viral transcription. (a) siRNAs against ASFV-QP509L showed significant depletion efficacy at 16 hpi (p ≤ 0.05). (b) Unchanged ASFV-CP204L mRNA levels between QP509L-depleted cells and control group. (c) QP509L-depleted cells showed significant lower mRNA levels of late ASFV-B646L gene (p ≤ 0.05). (d) Q706L siRNA_II showed significant knockdown efficacy at 16 hpi (p ≤ 0.05). (e) Unchanged ASFV-CP204L mRNA levels between Q706L- knockdown cells and control group. (f) Q706L-depleted cells showed significantly lower mRNA levels of ASFV-B646L gene (p ≤ 0.05). Results are shown as average ± standard error (AVG ± S.E.), between the number of molecules of each viral transcript and the number of Cyclophilin A mRNA molecules (reference gene). Three independent experiments were performed in duplicate.
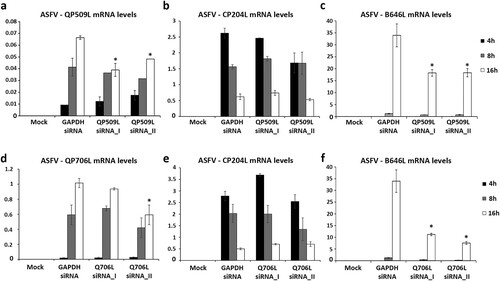
Figure 6. ASFV-QP509L and ASFV-Q706L downregulation disrupts ASFV DNA replication and progeny production. (a) QP509L and Q706L-depleted cells showed a decreased number of ASFV genomes [2.21 × 10⁹ genomes/ml using QP509L siRNA_I (−26%), 1.39 × 10⁹ genomes/ml for QP509L siRNA_II (−53%), 8.53 × 10⁸ genomes/ml for Q706L siRNA_I (−71%) and 9.45 × 10⁸ genomes/ml using Q706L siRNA_II (−68.32%)] when compared to the control group (2.98 × 10⁹ genomes/ml, p ≤ 0.05). Results represent the mean of three independent experiments. (b) A statistically significant reduction in viral yields was observed between ASFV-infected Vero cells (MOI of 0.1) transfected with siRNAs against ASFV-QP509L and ASFV-Q706L (−82.2% and −99.4% for QP509L siRNA I and II, respectively, and −92.5% and 98.6% for Q706L siRNA I and II), in comparison with the GAPDH siRNA-transfected infected cells (p ≤ 0.05). Results were obtained from three independent experiments. Error bars represent standard error (SE) of the mean values.
![Figure 6. ASFV-QP509L and ASFV-Q706L downregulation disrupts ASFV DNA replication and progeny production. (a) QP509L and Q706L-depleted cells showed a decreased number of ASFV genomes [2.21 × 10⁹ genomes/ml using QP509L siRNA_I (−26%), 1.39 × 10⁹ genomes/ml for QP509L siRNA_II (−53%), 8.53 × 10⁸ genomes/ml for Q706L siRNA_I (−71%) and 9.45 × 10⁸ genomes/ml using Q706L siRNA_II (−68.32%)] when compared to the control group (2.98 × 10⁹ genomes/ml, p ≤ 0.05). Results represent the mean of three independent experiments. (b) A statistically significant reduction in viral yields was observed between ASFV-infected Vero cells (MOI of 0.1) transfected with siRNAs against ASFV-QP509L and ASFV-Q706L (−82.2% and −99.4% for QP509L siRNA I and II, respectively, and −92.5% and 98.6% for Q706L siRNA I and II), in comparison with the GAPDH siRNA-transfected infected cells (p ≤ 0.05). Results were obtained from three independent experiments. Error bars represent standard error (SE) of the mean values.](/cms/asset/db362863-721c-4be1-90f7-8587d6e93502/temi_a_1578624_f0006_ob.jpg)
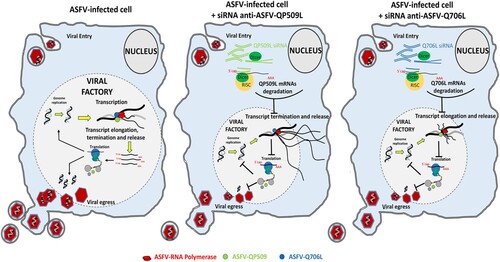
Figure 7. Proposed working model for ASFV-QP509L and ASFV-Q706L RNA helicases. Considering the experimental data available for ASFV-QP509L and ASFV-Q706L orthologous (A18R and D6/D11 SF2 RNA helicases of Vaccinia virus, respectively), our model hypothesized that absence of ASFV-QP509L on the transcription complex will lead to continuous reading of neighbouring viral ORFs and transcriptionally silenced regions, giving rise to an accumulation of long RNAs, with its release being also affected. In parallel, our working model postulates that downregulation of ASFV-Q706L will disrupt transcription elongation and termination with serious implications in viral progeny production.