Figures & data
Figure 1. Isolation of Ca. N. mikurensis from patient blood into tick cell lines and passage of the infection. (a) Diminishing Cycle threshold (CT) values of Ca. N. mikurensis PCR amplicons in tick cell lines derived from I. ricinus (IRE/CTVM20) and I. scapularis (ISE6) inoculated with either whole blood (continuous lines) or plasma/buffy coat specimens (dashed lines) from two patients with neoehrlichiosis (SE15; blue symbols, and SE17; red symbols, ). PCR results from undiluted tick cell extracts are shown. (b) CT values following passage of the infection (isolate SE15) from infected tick cell lines ISE6 and IRE/CTVM20 to uninfected homologous tick cell lines.
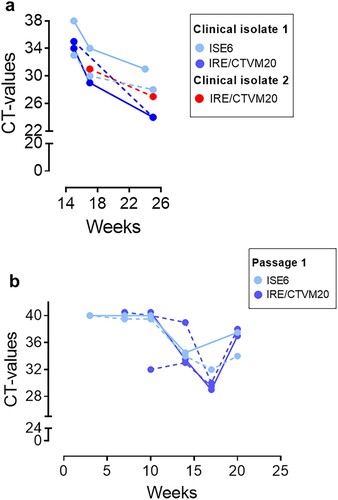
Table 1. Clinical data of patients whose blood samples were included in the study.
Figure 2. Visualization of Ca. N. mikurensis infection of tick cell lines. (a) Image flow cytometer depiction of I. scapularis ISE6 cells 9 weeks after the first passage of the infection, which originally had been maintained for 25 weeks of culture after inoculation with an infected blood sample (SE15). The cells were labelled using a panbacterial DNA probe (EUB) in green and a Ca. N. mikurensis-specific DNA probe (NEO) in yellow; bright field image (BF); red staining (DRAQ5) of the host cell nucleus (tick). Overlay image of all stains shows complete congruence of bacteria in the cytoplasm labelled using the panbacterial and Ca. N. mikurensis probes. (b) Panels as in (a) using I. ricinus IRE/CTVM20 cells inoculated with infected blood from patient SE15. (c) Mock-infected IRE/CTVM20 cells stained using the Ca. N. mikurensis-specific DNA probe (NEO), the panbacterial DNA probe (EUB) and host cell nucleus stain DRAQ5. (d) No hybridization signal was seen when infected IRE/CTVM20 cells were incubated with the control probes non-EUB338 or non-Neo. (e)–(f) Giemsa-stained cytocentrifuge smears of tick cells infected in vitro with Ca. N. mikurensis. (e) I. scapularis ISE6 cell line. (f) I. ricinus IRE/CTVM20 cell line. Arrows indicate bacterial inclusions.
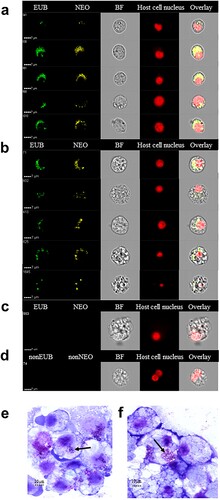
Figure 3. Visualization of Ca. N. mikurensis infection of primary endothelial cell lines. (a)–(b) Image flow cytometer depiction of endothelial cells from pulmonary artery 7–14 days after inoculation with homogenized tick cells that had been infected from clinical isolate SE25. The endothelial cells were labelled using a panbacterial DNA probe (EUB) in green and a Ca. N. mikurensis-specific DNA probe (NEO) in yellow; red staining (DRAQ5) of the host cell nucleus (endothelium), after (a) 1 week and (b) 2 weeks of culture. (c) Uninfected negative control endothelial cells did not stain with the EUB388 probe nor with the Neo probe. (d) Verification that the infected cells were endothelial by labelling them with a mAb against the von Willebrand factor (vWF, purple), the Ca. N. mikurensis-specific DNA probe (NEO, green), a mAb against CD146 (yellow), and staining of the endothelial cell nucleus (DRAQ5, red). Bright field images (BF) and overlay images are shown. (e) Graph illustrating the percentage of the two endothelial cell lines that were infected by Ca. N. mikurensis (⬤ = pulmonary artery endothelial cells, ▪ = skin microvasculature endothelial cells) and the fraction of the cytosol of these respective cell lines that were occupied by bacteria (○ = pulmonary artery endothelial cells, □ = skin microvasculature endothelial cells), after 2, 3 and 4 weeks of culture. (f) Giemsa-stained preparation of a cutaneous microvasculature endothelial cell infected in vitro by Ca. N. mikurensis. Arrows indicate bacterial inclusions.
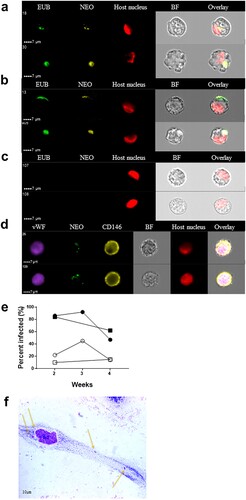
Figure 4. Immune serum stains bacterial inclusions in an endothelial cell line infected in vitro using a clinical isolate of Ca. N. mikurensis. (a) Image flow cytometer depiction of two infected endothelial cells incubated with serum from a patient with neoehrlichiosis (SE13), followed by a secondary FITC-labelled anti-human mAb. (b) The immune serum stains the same inclusions in endothelial cells as the Ca. N. mikurensis-specific probe. Bright field images (BF) and overlays are also shown. (c) Representative images show that the infected endothelial cells were not stained using control serum from a healthy individual or culture medium, followed by the secondary antibody.
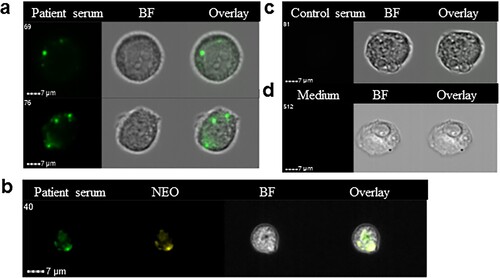
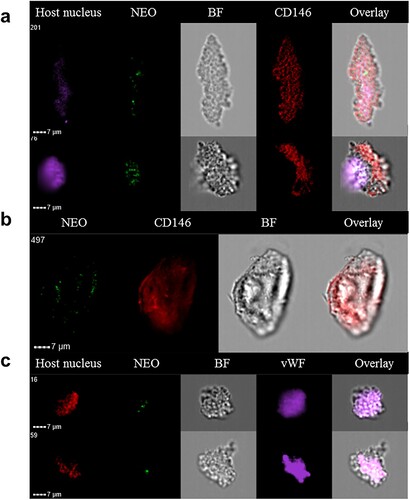
Figure 5. Circulating endothelial cells isolated from the blood of a neoehrlichiosis patient stain positive for Ca. N. mikurensis. Image flow cytometer depiction; the cells (derived from patient SE26) were stained using the Ca. N. mikurensis-specific DNA probe (NEO, green), DAPI or DRAQ5 (host cell nucleus, purple or red), and either the mAb anti-CD146 (red) or the mAb anti-von Willebrand factor (vWF, purple). Bright field image (BF) and overlays are shown for five different endothelial cells.