Figures & data
Table 1. Case information of TB patients and healthy controls.
Figure 1. A potential TB diagnostic model was established when combined miR-423-5p, miR-17-5p and miR-20b-5p as a panel. (A) The levels of four serum miRNAs were measured by qPCR from TB patients (N = 70) and healthy controls (HCs, N = 51). Median values are shown by horizontal lines. (B) The Receiver Operating Characteristic curve of miR-17-5p, miR-20b-5p, miR-423-5p and the combined model were analyzed. N: number of subjects. *P < 0.05, ** P < 0.01, *** P < 0.001.
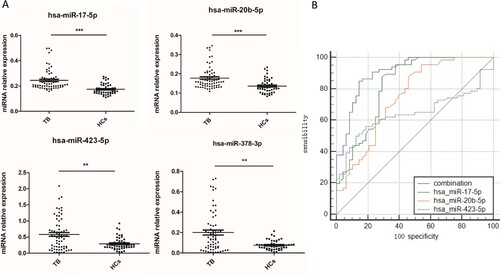
Figure 2. MiR-423-5p was predicted as a candidate in regulating autophagosome maturation. (A) The Volcano Plot of the differentially expressed miRNAs from TB patients and healthy controls (HCs). (B) Genes targeted by differentially expressed miRNAs were enriched in the Gene Ontology term of positive regulation of autophagy. (C) Genes targeted by differentially expressed miRNAs were enriched in the lysosome pathway. (D) All of the 30 autophagosome maturation-related genes were targeted by differentially expressed miRNAs.
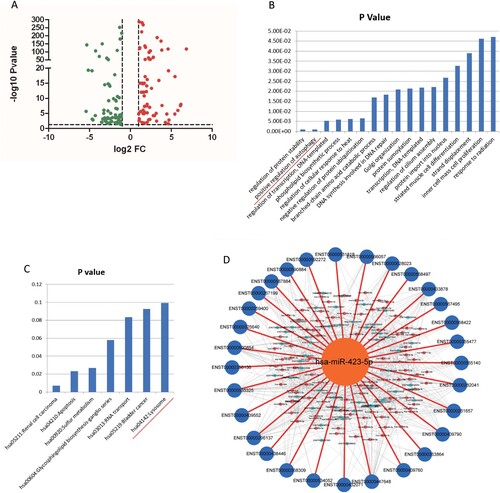
Figure 3. MiR-423-5p inhibits autophagosome maturation by suppressing autophagosome-lysosome fusion. (A) The expression ratio of mir-423-5p in the PBMCs of TB patients/healthy controls (HCs) from GSE29190 and GSE25435. (B) The levels of miR-423-5p in the cells transfected with miR-423-5p mimic or NC mimic. (C) The protein levels of P62 and LC3-II in the cells transfected with miR-423-5p mimic or NC mimic were tested by western blot. Target protein was normalized with β-actin. −/−: no starvation/no BA, +/−: 1 h starvation/no BA, +/+: 1 h starvation/50nM BA, −/+: no starvation/50nM BA. The experiments repeated more than three times. (D) The number of LC3-GFP dots and the co-localization of LC3-GFP puncta with lysosomes (lysotracker red DND) in the macrophages treated with miR-423-5p mimic or NC mimic were analyzed. More than 20 macrophages from three independent experiments were analyzed. Scale bars: 5μm. (E) Autophagosomes in the macrophages treated with miR-423-5p mimic or NC mimic were observed by electron microscopy. Autophagosomes are indicated by arrows. The number of autophagosomes from an accumulated area of >200 μm2 (>20 cells) was statistically analyzed. Scale bars: 1μm. (F) The lysosomal proteolytic activity of the macrophages treated with miR-423-5p mimic or NC mimic was analyzed by DQ-BSA. The fluorescent intensity from at least 40 cells was quantified. Scale bars: 10 μm. All statistical data, except (A) are presented as mean ± SD, and error bars indicate the SD. NC: negative control. *P < 0.05, ** P < 0.01, *** P < 0.001.
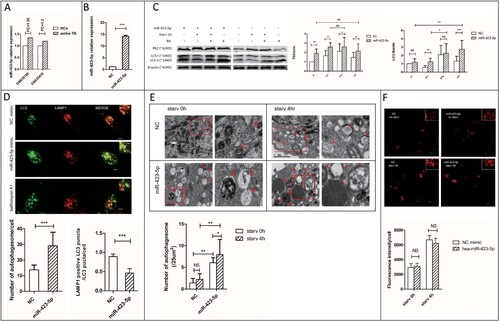
Figure 4. The mRNA and protein expression levels of VPS33A were measured. (A) The relative expression levels of miR-423-5p in the cells transfected with mimic (NC or miR-423-5p) or inhibitor (NC or miR-423-5p). Target miRNA was normalized with hsa-miR-16. (B) The mRNA levels of the five target genes in the cells transfected with mimic (NC or miR-423-5p) or inhibitor (NC or miR-423-5p) were analyzed, whether the cells were starvated or not. (C) The protein levels of VPS33A in the macrophages transfected with inhibitor (NC or miR-423-5p) and those treated with starvation (0 h or 1 h) were analyzed. The statistical results were obtained from more than three independent experiments. Target genes were normalized with β-actin. Data are presented as mean ± SD, and error bars indicate the SD. NC: negative control. * P < 0.05, ** P < 0.01, *** P < 0.001.
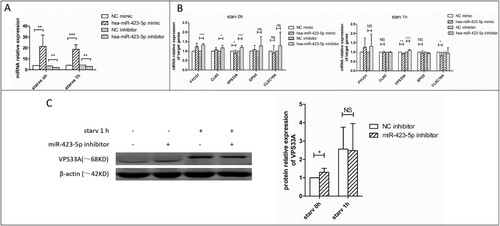
Figure 5. VPS33A was the direct target of miR-423-5p. (A) The location of the two miR-423-5p binding domains. Interaction domains are indicated by red font. Mutant sequences are indicated by bold font. (B) The structure diagram of the constructed plasmids. (C) A 2 × 4 (factor of miRNA: NC mimic and miR-423-5p mimic, 100 nM; factor of luciferase reporter plasmid: pmirGLO vector (mock), pmirGLO-WT, pmirGLO-MT1, pmirGLO-MT2 and pmirGLO-MT (1 + 2)) orthogonal experiment for Dual-Glo-Luciferase-Assay was performed. (D) The co-localization of LC3-GFP puncta with lysosomes in the macrophages transfected with VPS33A specific siRNA (negative siRNA as NC) was analyzed. More than 20 cells from three independent experiments were analyzed. Scale bars: 5 μm. (E) The expression levels of VPS33A in the macrophages transfected with VPS33A specific siRNA or NC siRNA were analyzed. (F) The co-localization of LC3-GFP puncta with lysosomes in the macrophages transfected with NC mimic, miR-423-5p mimic, or miR-423-5p mimic + pcDNA-VPS33A were analyzed. More than 20 cells from three independent experiments were analyzed. Scale bars: 5 μm. (G) The protein levels of VPS33A in the macrophages transfected with NC mimic, miR-423-5p mimic, or miR-423-5p mimic + pcDNA-VPS33A were analyzed by western blot. The statistical results were obtained from more than three independent experiments. Target genes were normalized with β-actin. Data are presented as mean ± SD, and Error bars indicate the SD. NC: negative control. *P < 0.05, ** P < 0.01, *** P < 0.001.
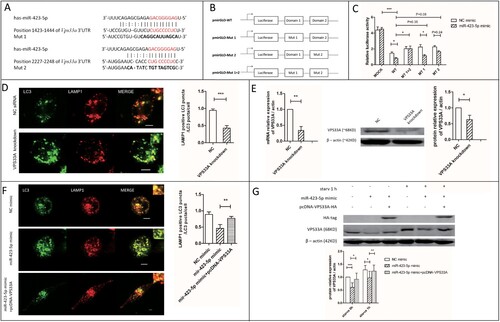
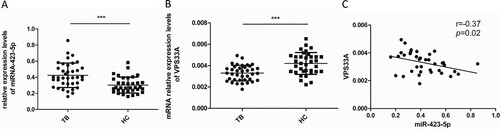
Figure 6. Spearman correlation coefficients revealed an inverse correlation between the mRNA levels of VPS33A and miR-423-5p in the PBMCs of TB patients. (A) The levels of miR-423-5p were measured by qPCR in the PBMCs of TB patients (N = 38) and HCs (N = 35). (B) The mRNA levels of VPS33A were measured by qPCR in the PBMCs of TB patients (N = 38) and HCs (N = 35). (C) Spearman correlation coefficient between the mRNA levels of VPS33A and miR-423-5p in the PBMCs of TB patients was calculated. Median values are shown by horizontal lines. N: number of subjects. TB: pulmonary tuberculosis. HCs: healthy controls. * P < 0.05, ** P < 0.01, *** P < 0.001.