Figures & data
Table 1. Dynamic changes in specimen sources and basic demographics of inpatients with infection caused by S. aureus from 2008 to 2017.
Figure 1. Dynamic changes in the annual proportion of different clinical specimens from which MRSA or MSSA isolates were recovered, 2008–2017.
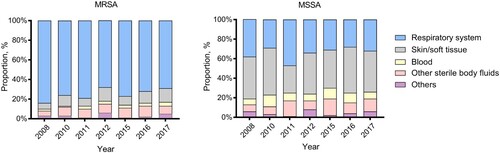
Figure 2. The constantly changing antibiotic resistance profile of (a) Total S. aureus isolates, (b) MRSA isolates, (c) MSSA isolates, 2008–2017. FOX: cefoxitin; PEN: penicillin; GEN: gentamicin; CZO: cefazolin; ERY: erythromycin; FOT: fosfomycin; RIF: rifampin; SXT: trimethoprim/sulfamethoxazole; LVX: levofloxacin.
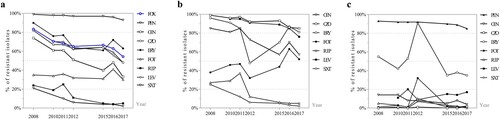
Table 2. Dynamic changes in annual resistance of MRSA and MSSA to several antimicrobial agents from 2008 to 2017 (rate of resistance, %).
Figure 3. Genotypes and prevalence of certain S. aureus clones from different clinical specimen of inpatients, 2008–2017. (a) The dynamic changes of the percentage of MRSA or MSSA clones recovered from the indicated year. Blocks are coloured to reflect the proportion of corresponding sequence type. (b) Prevalence of the epidemic HA-MRSA clones, ST5 and ST239, and the increasingly emerging dominant CA-MRSA clones, ST398 and ST59 among different clinical specimens.
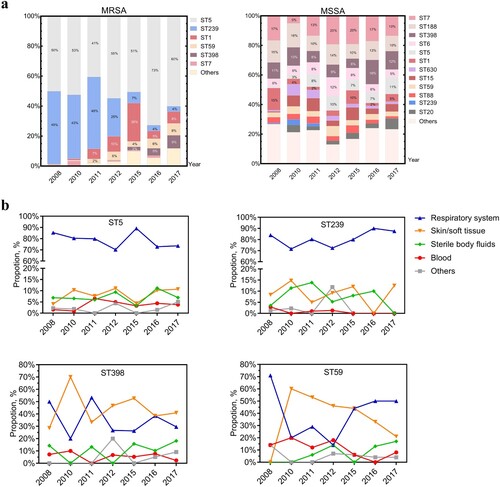
Table 3. Percentage of major clone complex (CC), sequence types (ST) and spa types among S. aureus isolates, 2008–2017.
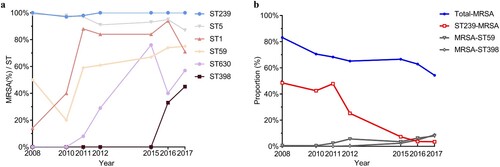
Figure 4. The dynamic changes of the prevalence of MRSA among different clones. (a) The dynamic changes of MRSA rate among certain sequence types. Significantly increasing trends of MRSA isolation rate among ST1, ST398, ST59, and ST630 were observed (p < 0.0001). (b) The dynamic changes of isolation rate of total MRSA, ST239-MRSA, ST398-MRSA and ST59-MRSA isolates among all S. aureus isolates among the given year, a liner positive correlation between the dramatic decline in prevalence of ST239-MRSA (red line) and decreasing prevalence of MRSA (blue line) (p < 0.05) was observed.