
Figures & data
Figure 1. Study flow chart. Severe febrile illness is defined as having severe tachypnea (respiratory rate ≥97th percentile for age and temperature), severe tachycardia (heart rate ≥90th percentile for age and temperature), Hypoxemia (SaO2 < 90%), inability to tolerate oral fluids and/or neurological danger signs (such as coma or >2 convulsions in 24 h). The diagnosis of “fever without source” is attributed when the probable cause of a febrile illness cannot be determined by history or physical examination. The diagnosis of “malaria” is attributed in case of positive malaria-specific quantitative PCR, targeting multiple genomic copies of the conserved C-terminus of the var gene family (detection level: 0.1 parasite/µl). HTS: high-throughput sequencing, DicV: dicistrovirus, RT-PCR: reverse transcription PCR.
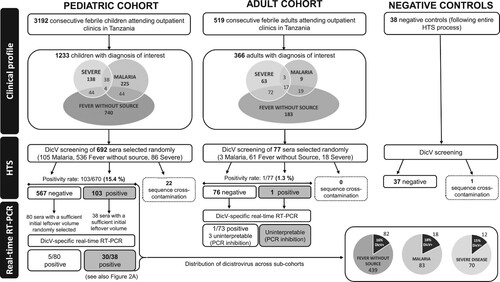
Table 1. Comparative analysis between dicistrovirus-positive and negative febrile children.
Figure 2. Analysis of Dicistrovirus sequences. (a) Location of DicV sequences with more than fifty percent DicV genome coverage obtained by de novo analysis for positive subjects. A schematic representation of the major ORFs of the DicV genome is featured at the top of the figure (Hel: helicase domain [pfam00910]; RdRp: RNA-dependent RNA polymerase domain [pfam00680]; Capsid domains include two Picornavirus capsid-like domains [cd00205], a DicV VP4 domain and CRPV capsid protein like domain [pfam08762]). On the right side is indicated when the presence of DicV could be verified by real-time RT-PCR (*) in sera with sufficient leftover volume and/or by RT-PCR followed by classical sequencing (▴). (b) Phylogenetic tree of the RdRp region of DicV. The 370-residue amino acid sequence considered for RdRp alignment is between position 1435 and 1804 of ORF1. Dicistrovirus sequences found in human blood are in bold font; the three complete coding sequences obtained in this study (TANZANIA 1–3), the Human blood-associated dicistrovirus sequence reported from a Peruvian patients with fever of unknown aetiology [Citation21], and the KENYA sequence detected by our retrospective analysis in one pool (SRR4255933) from a study that investigated the plasma virome of febrile adult Kenyans [Citation22]. (c) Phylogenetic tree of the capsid region of DicV. The 791-residue amino acid sequence considered for capsid alignment is between position 73 and the terminus of ORF2. Dicistrovirus sequences found in human blood are in bold font; the three complete coding sequences obtained in this study (TANZANIA 1–3), and the Human blood-associated dicistrovirus sequence reported from a Peruvian patients with fever of unknown aetiology [Citation21].
![Figure 2. Analysis of Dicistrovirus sequences. (a) Location of DicV sequences with more than fifty percent DicV genome coverage obtained by de novo analysis for positive subjects. A schematic representation of the major ORFs of the DicV genome is featured at the top of the figure (Hel: helicase domain [pfam00910]; RdRp: RNA-dependent RNA polymerase domain [pfam00680]; Capsid domains include two Picornavirus capsid-like domains [cd00205], a DicV VP4 domain and CRPV capsid protein like domain [pfam08762]). On the right side is indicated when the presence of DicV could be verified by real-time RT-PCR (*) in sera with sufficient leftover volume and/or by RT-PCR followed by classical sequencing (▴). (b) Phylogenetic tree of the RdRp region of DicV. The 370-residue amino acid sequence considered for RdRp alignment is between position 1435 and 1804 of ORF1. Dicistrovirus sequences found in human blood are in bold font; the three complete coding sequences obtained in this study (TANZANIA 1–3), the Human blood-associated dicistrovirus sequence reported from a Peruvian patients with fever of unknown aetiology [Citation21], and the KENYA sequence detected by our retrospective analysis in one pool (SRR4255933) from a study that investigated the plasma virome of febrile adult Kenyans [Citation22]. (c) Phylogenetic tree of the capsid region of DicV. The 791-residue amino acid sequence considered for capsid alignment is between position 73 and the terminus of ORF2. Dicistrovirus sequences found in human blood are in bold font; the three complete coding sequences obtained in this study (TANZANIA 1–3), and the Human blood-associated dicistrovirus sequence reported from a Peruvian patients with fever of unknown aetiology [Citation21].](/cms/asset/7a49db21-2922-4474-93ea-7b8ce539d1d2/temi_a_1603791_f0002_oc.jpg)
Table 2. Primer and probe sequences. Fwd: primer forward, Rev: primer reverse, AT: PCR annealing temperature, NT: nucleotide.
Figure 3. Monthly Dicistrovirus-positivity rate in febrile children. Bar graphs represent the positivity rates (%) (Left Y axis) of DicV RNA across each month of the study. Too few specimens (n = 10) were collected in December 2014 and February 2016 to provide reliable positivity rates, and, thus, are not represented on the graph. The total number of sera collected appear in the base of each bar. A dotted line with shaded CI95% shows a fractional polynomial trendline for predicted DicV positivity (also featured on the left Y axis). The rainfall recorded in Dar es Salaam (mm; adapted from https://www.worldweatheronline.com/dar-es-salaam-weatheraverages/dar-es-salaam/tz.aspx) over the patient recruitment period appears as a shaded graphic in the background (Right Y axis). Corresponding seasons are indicated below.
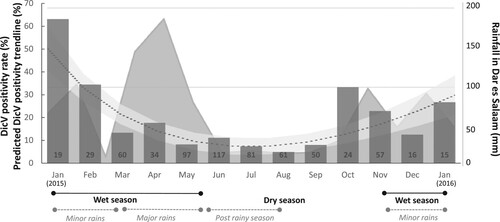
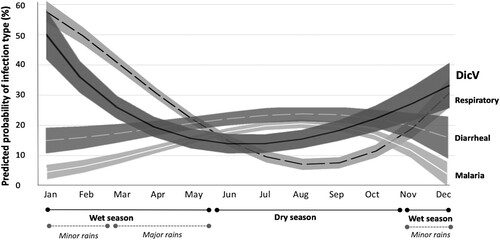
Figure 4: Temporal distribution of diseases representing the major modes of infectious transmission (airborne, fecal-oral and mosquito-borne) compared to DicV prevalence. The mean predicted prevalences (fractional polynomial trendlines) and their 95% confidence intervals (shaded areas around trendlines) are depicted for the probability of having the diagnoses of 1: “Respiratory infection” (dashed black line), 2: “Diarrheal disease” (white dashed line) and 3: Malaria (white solid line). The predicted prevalence of DicV is shown as a solid black line. The months of the entire 2015 recruitment period are depicted. Seasons are indicated below. DicV: Dicistrovirus.