Figures & data
Figure 1. ACC inhibitors reduce flavivirus multiplication at non-cytotoxic concentrations. (A) Chemical structure of ACC inhibitors PF-05175157, PF-05206574 and PF-06256254. (B) Effect of ACC inhibitors on cell viability. Vero cells were treated for 24 or 48 h with PF-05175157, PF-05206574 or PF-06256254 and cell viability was determined by measuring cell ATP concentrations (n = 4). (C) Inhibition of flavivirus multiplication by ACC inhibitors. Vero cells were infected with the flaviviruses WNV, ZIKV or DENV (MOI of 1 PFU/cell) and 1 h after virus addition, viral inoculum was removed and culture medium containing the various concentrations of the compounds was added. The virus yield was determined as the viral titer in infected supernatants after 24 h (WNV and ZIKV) or 48 h (DENV) of infection (n = 3). Two tailed Student’s t-test P values between Vehicle and each compound concentration are Bonferroni-corrected for multiple comparisons. *P < 0.05, **P < 0.01, ***P < 0.001. Data represent the means ± SDs.
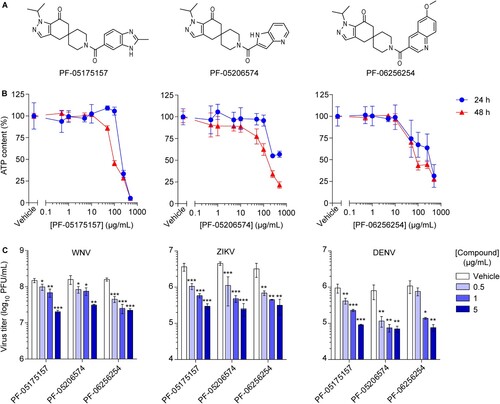
Table 1. Chemical properties and antiviral activities of ACC inhibitors
Figure 2. Inhibition of ACC reduces viral load in mice. (A) Total plasma level curves of the compounds after a single oral dose (p.o.) of 15 mg/kg for PF-05175157 or 100 mg/kg in the case of PF-05206574 and PF-06256254. Compounds were administered to fasted male mice by oral gavage (n = 3). Data represent the means ± SDs. (B-D) Antiviral activity of PF-05175157 against WNV in mice. (B) Experimental design. Eight-week-old female CD-1 mice were treated with 20 mg/kg of PF-05175157 twice a day p.o. starting 1 d before infection. Animals were infected by the i.p. route with 1 × 10⁴ PFU/mouse of WNV. (C and D) Viral burden in (C) serum and (D) tissues (brain, spleen, liver, kidney and lungs) was determined by quantitative RT-PCR at the indicated times post-infection. Symbols represent individual mice pooled from two independent experiments (n = 8–12). Two-tailed Mann Whitney test P values are indicated in (B) *P = 0.0206, ***P < 0.0001 and (C) *P = 0.0266. (E-G) Infection with WNV in ACC2-deficient mice. (E) Experimental design. Eight-week-old sex-matched WT and ACC2-/- mice were infected by the i.p. route with 1 × 10⁴ PFU/mouse of WNV (n = 10 for WT; n = 9 for ACC2-/-). Viral load in serum (F) or organs (brain, liver, kidney and lung) (G) of infected WT or ACC2-/- mice was determined by quantitative RT-PCR at the indicated times post-infection (n = 9–10 for WT; n = 8–9 for ACC2-/-). Symbols represent individual mice. Two-tailed Mann Whitney test P values is indicated in (E) *P = 0.0244.
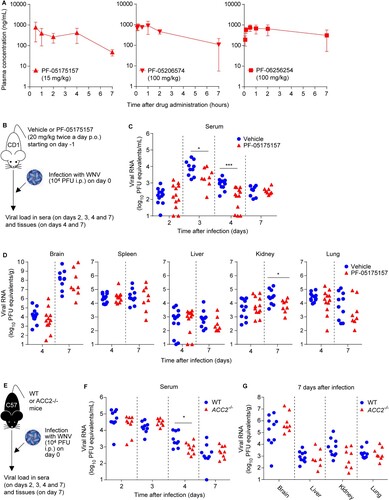
Table 2. Preclinical pharmacokinetics of the ACC inhibitors.
Figure 3. Impact of ACC inhibitors on host lipids. (A) Changes in the lipidome of Vero cells after 24 h of treatment with PF-05175157, PF-05206574 or PF-062562545 (5 µg/mL). Fold change in lipid levels were calculated as the log2 (Treated/Vehicle) for each lipid class. Data are expressed as the means ± SDs (n = 3 - 4). Two tailed Student’s t-test P values are Sidak-Bonferroni-corrected for multiple comparisons (*P <0.05, **P <0.01, ***P <0.0001). (B) Heatmap displaying the effect of PF-05175157, PF-05206574 or PF-06256254 on the individual lipid species analyzed. Cells were treated as described in A. Red and blue denote an increase or a decrease in lipid species, respectively. Data correspond to the mean of 3–4 repeats (n = 3-4). Sphingolipids (Cer, ceramide; SM, sphingomyelin), glycerophospholipids (PC, phosphatidylcholine; PE, phosphatidylethanolamine, and PS, phosphatidylserine), diacylglycerol (DAG), and triacylglycerol (TAG) were annotated using “C followed by the total fatty acyl chain length:total number of unsaturated bonds” and the “lipid subclass”. If the sphingoid base residue was dihydrosphingosine, the name contained a “DH” prefix. For glucosylceramides and lactosylceramides a “Gluc” or “Lac” prefix was respectively added to indicate the presence of the sugar moiety. Plasmalogens and lysophospholipids were annotated as described above, except that a “p” or “L” prefix was included, respectively.
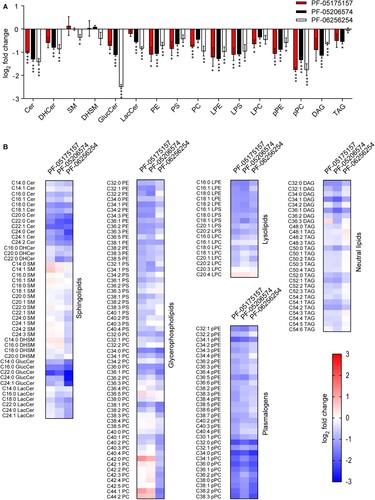
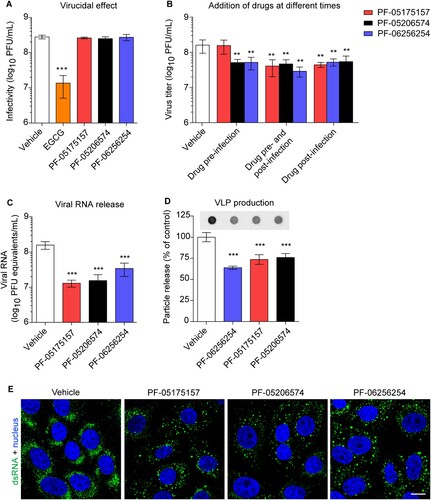
Figure 4. Mechanism of inhibition of WNV multiplication by ACC inhibitors. (A) Lack of virucidal effect of PF-05175157, PF-05206574 or PF-06256254. The same amount of WNV (∼ 3 × 10⁸ PFU) was treated with each compound (5 µg/mL) or drug vehicle for 1 h at 37°C in culture medium and the infectivity in each sample was determined by plaque assay. EGCG was included in the experiments as a positive control of a compound with virucidal activity (n = 3). (B) Time of addition experiments of ACC inhibitors. Vero cells were infected with WNV (MOI of 1 PFU/cell) and treated with PF-05175157, PF-05206574 or PF-06256254 (5 µg/mL) or drug vehicle only 1 h before virus inoculation (drug pre-infection), 1 h after virus inoculation (drug post-infection), 1 h before virus inoculation and during infection (drug pre-infection and post-infection), or left untreated (vehicle). Virus yield in supernatant was determined 24 h after infection by plaque assay (n = 3). (C) Determination by quantitative RT-PCR of genome containing particles released in cell cultures infected with WNV (MOI of 1 PFU/cell) and treated with ACC inhibitors (5 µg/mL) from 1 h after virus inoculation. Viral RNA was quantified 24 h after infection. (D) Production of WNV VLPs by HeLa cells stably transfected with a plasmid that expresses WNV prM and E proteins. HeLa3-WNV cells stably expressing WNV prM and E proteins were treated with ACC inhibitors (5 µg/mL) or drug vehicle and the amount of VLPs released to the culture medium was analyzed by enzyme-linked immunodot assay using a monoclonal antibody against WNV envelope protein as described in Material and methods. The graph displays the quantification of the amount of VLPs released (n = 4). (E) Detection of dsRNA in Vero cells infected with WNV (MOI of 1 PFU/cell) and treated with ACC inhibitors (5 µg/mL) from 1 h after virus inoculation. Cells were fixed and processed for immunofluorescence 24 h post-infection. Scale bar, 10 µm. In (A, B, C, and D) two tailed Student’s t-test P values between Vehicle and each compound and each treatment Bonferroni-corrected for multiple comparisons. *P < 0.05, **P < 0.01, ***P < 0.001. Data represent the means ± SDs.