
Figures & data
Figure 1. Honokiol inhibits the production and hemolytic activity of staphylococcal Hla. (a) WB analysis of Hla production. Culture supernatants of S. aureus 8325-4 grown in the absence or presence of subinhibitory concentrations of Honokiol were detected with a specific antibody against Hla. (b,c) Hemolysis assays were performed with rabbit red blood cells in PBS. The addition of Honokiol reduced the hemolysis, as indicated by the colour attenuation (b), and the OD absorbance at 543 nm decreased (c). Bars show the mean values of the experiments (n = 3). **Indicates P < 0.01 when compared with the control group.
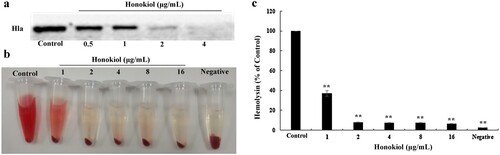
Figure 2. Honokiol protects A549 cells against S. aureus-mediated injury and apoptosis. (a) Survival rates of cells treated with S. aureus supernatants were compared with the survival rates of the control group treated with PBS in the MTT assay. (b) Apoptosis was analyzed by flow cytometry. A value for early apoptosis (a percentage) is recorded in the lower right-hand corner of each panel. (c) Early apoptotic rates in A549 cells treated with S. aureus supernatants. # Represents a significant difference. *Indicates P < 0.05 and **indicates P < 0.01 when compared with the control group.
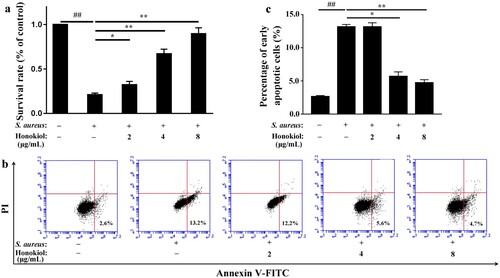
Figure 3. Honokiol inactivates the staphylococcal Hla-induced NLRP3 inflammasome. Immunoblotting analyses of NLRP3, ASC and caspase-1 production by RAW264.7 macrophage cells (a) and by liver tissues from mice (b) exposed to different treatments. GAPDH was used as an internal control.
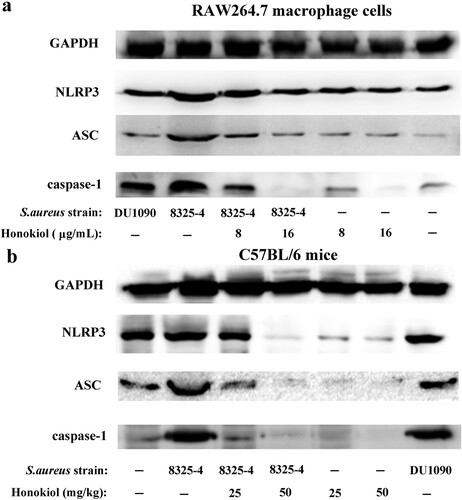
Figure 4. Honokiol suppresses S. aureus-induced inflammation in mice. (a) Histological analyses of mouse livers. C57BL/6 mice were administered an intraperitoneal injection of PBS as a control (image a), 200 μL of resuspended S. aureus DU1090 as a negative control (image b) or S. aureus 8325-4 as a positive control (image c) (1 × 10⁸ CFUs per 200 μL). After 3 h, S. aureus 8325-4-infected C57BL/6 mice were treated with 25 and 50 mg/kg of Honokiol (images d and e, respectively) for 24 h. Mouse liver tissues were stained with H&E (×20). The images shown are representative of the results from independent experiments (n = 3). The red arrows indicate the infiltrated cells. (b) IL-1β and IL-18 production in the blood serum collected from mouse eyes. Mice were treated as described above. *Indicates P < 0.05 and **Indicates P < 0.01 when compared with the control group.
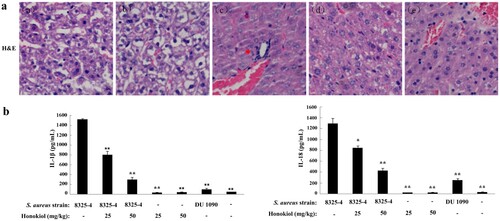
Figure 5. Honokiol binds to monomeric Hla without impairing its oligomerization. (a) The kinetics of Honokiol binding to Hla. The solid black lines show the best fit of the 1:1 binding model. The chromatic lines represent the kinetic signal response to the binding interaction. (b) Honokiol does not disrupt the deoxycholate-induced oligomerization of Hla (designated Hla7). The results shown are representative of the results from independent experiments (n = 3).
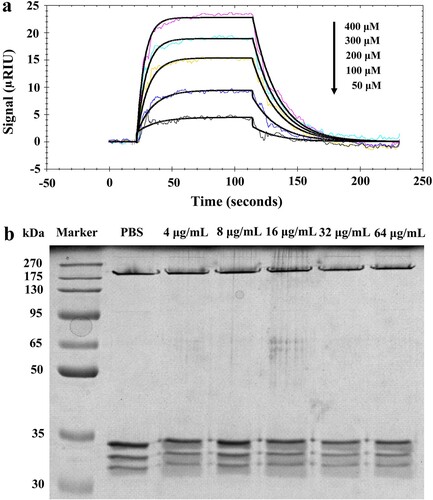
Figure 6. Computational characterization of Honokiol binding to Hla. (a) The monomeric structure of Hla is depicted based on homology modelling. (b) Close-up of the Honokiol docking site (the best energy mode) on the surface of Hla (red dot). Surface presentation demonstrating the structure of Hla (blue). c Binding pose of Honokiol in the binding pocket of Hla. (d) The final conformation of Honokiol bound to Hla. (e) The structure of the binding model shows the interaction of Honokiol with Hla residues in the binding pocket. Honokiol moieties are coloured gray and rendered as a stick representation.
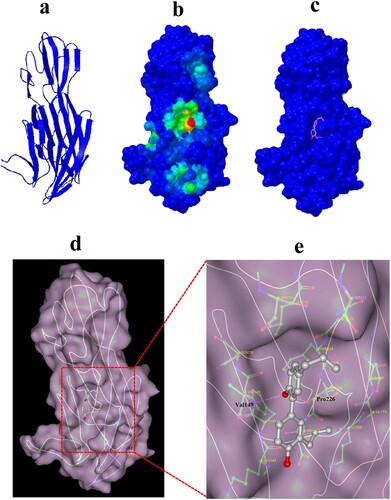
Figure 7. Predicted structure of Honokiol binding to Hla. (a) View of the heptamer down the sevenfold axis (PDB ID 7AHL). Each promoter is shown with a different colour and the predicted residues contacting Honokiol are shown as coloured sticks. (b) Ribbon representation of the heptamer viewed parallel to the sevenfold axis. (c) The ribbon representation of a protomeric subunit structure is extracted from the heptamer with the triangle region and stem labelled. (d) Ribbon representation of monomeric Hla-bound Honokiol with the allosteric region and residue information labelled. The allosteric region is coloured in pink. The residues LYS58, GLY59, and THR60 are coloured red. The residues SER218, LEU219, SER222, GLY223, PHE224, SER225, PRO226, and ASP227 are coloured purple. The residues LYS147, TYR148, VAL149 are coloured yellow. Honokiol is coloured orange. The interacting residues LYS147, TYR148, and VAL149 are located in the structure of the channel. Consequently, Honokiol influences the formation of the membrane channel or the channel structure, which leads to the loss of the heptamer function.
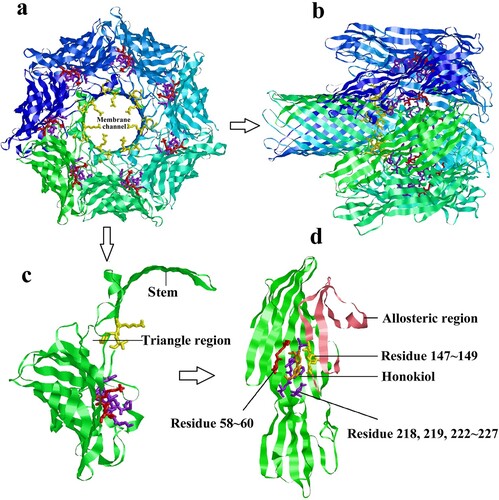
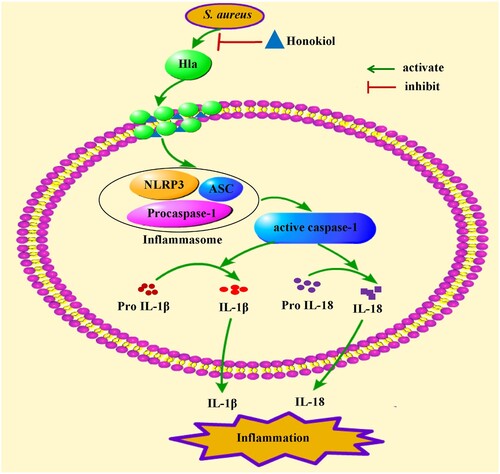
Figure 8. Mechanism of Honokiol-mediated inflammatory response inactivation. On the one hand, Honokiol reduces the production and the hemolytic activity of the staphylococcal Hla directly. On the other hand, Honokiol binds to monomeric Hla without impairing its oligomerization on the membrane of host cells. The resultant Hla-Honokiol complex inhibits the assembly of the NLRP3 inflammasome and the activation of caspase-1, which is involved in the processing of IL-1β and IL-18. These events promote apoptotic and pyroptotic cell death in parallel.
Supplemental Material
Download MS Word (11.9 MB)Data availability
The authors declare that all other data are available within the article and its supplementary information files or available from the corresponding author upon request.