Figures & data
Figure 1. Tumour growth patterns resulting from IV infection with CRPV virions via marginal ear vein injection. (A) Tumour growth on one (NZW#1) of the three animals at week 11 post infection is shown. (B) one (NZW#3) of the four additional rabbits (NZW#3-6) infected by IV injection of virions equivalent to 5.5 × 10⁹ viral DNA equivalents. All developed tumours at six weeks post infection. Both tumours (A and B) exhibited an appearance similar to tumours from local skin tumours initiated with high to low dilutions of virus at week six post infection (C). (D, F) The tumours induced via marginal ear vein (IV) infection have similar morphology and histology (H&E, 20×) to those (H) initiated by local infections (H&E, 20×). Viral DNA was detected by in situ hybridization (ISH) in tumours induced by both intravenous (E, G) and local skin infections (I, 20×, arrows).
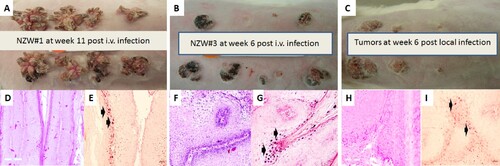
Figure 2. Viral RNA transcripts in four tumour lesions of four individual rabbits IV infected by CRPV virions through marginal ear vein injection. Total RNA isolated from each tumour and depleted of ribosomal RNA was analyzed by RNA-seq. By mapping the RNA-seq raw reads to the newly arranged linear CRPV genome starting from nt 7421 and ending at nt 7420 and by uploading these uniquely mapped viral RNA reads to the Integrative Genomics Viewer (IGV) program to visualize reads coverage profile along with the CRPV genome, three major coverage peaks were visualized in the E6, E7 and E1^E4 regions among all tumour tissues.
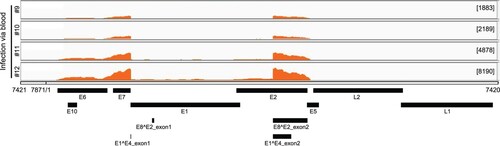
Figure 3. Dysregulation of the host transcriptome by CRPV infection. (A) Principle component analysis of the ten RNA-seq samples. (B-C) Volcano plots of 17742 annotated genes assayed in each contrast of our analysis. The x-axis is the log2 fold change in expression. The y-axis is p-value adjusted for multiple comparisons. Red dots indicate the genes with both significant differential expression and large absolute fold change relative to control; grey dots indicate those genes that do not meet these criteria. Vertical dashed lines represent fold change thresholds (absolute fold change ≥ 2.0) and horizontal dashed lines represent the significance threshold (adjusted p ≤ 0.05). (D) Venn diagram of all 5224 genes with differential expression (adjusted p ≤ 0.05 and absolute fold change ≥ 2.0) in the wart tissues induced by local skin or IV CRPV infection over the normal control skin tissues. Numbers with arrows indicate the number of genes (after all filters) up- and down-regulated in each experimental group relative to control group. (E) Heat map showing the top 100 up-regulated and top 100 down-regulated genes with significantly different expression in the tumours induced by both local skin and those induced by IV infections, relative to control. A colour scale bar represents relative gene expression level within centred rows. Unit variance scaling has been applied to rows. Both rows and columns are clustered using Euclidean distance and complete linkage.
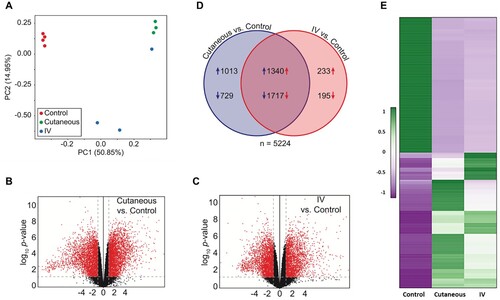
Figure 4. Representative host genes with differential expression in skin tumours induced by both routes of CRPV infections. (A) Heat map showing the expression of 9 selected host genes chosen based on their expression abundance and cellular functions. A colour scale bar represents relative gene expression level within centred rows. Unit variance scaling has been applied to rows. Both rows and columns are clustered using Euclidean distance and complete linkage. (B) Verification of differentially expressed rabbit genes in RNA-seq results by real-time RT-qPCR. Consistent with RNA-seq data, SLN, TAC1, MYH8, and PGAM2 were down-regulated in both CRPV blood infection (Animal #9, #11, and #12) and CRPV skin infection (Animal#6, #7, and #8) animals relative to those in normal control animals, whereas SDRC7, KRT16, S100A9, IL36G, and FABP9 were up-regulated in both CRPV skin infection and CRPV blood infection animals compared to normal controls. The Y-axis indicates relative gene expression levels calculated by 2-ΔΔCт and the X-axis indicate the different samples. NC, gene expression in the normal tissue, was set to 1 after normalization to GAPDH. (C) Western blot analysis of representative samples from normal skin and warts induced by cutaneous or intravenous (IV) CRPV infection for the expression of S100A9 and APOBEC2. Cellular β-tubulin served as a loading control.
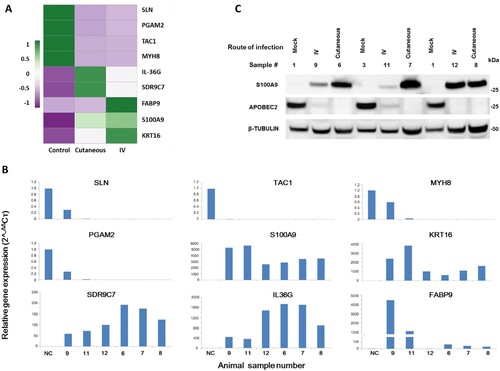
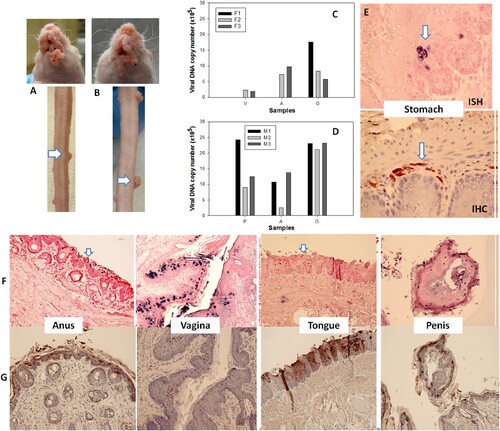
Figure 5. Tumour growth at cutaneous sites (muzzle and tail) and viral DNA detection at the four mucosal (vaginal, V; penile, P; anal, A; and oral, O) sites after MmuPV1 IV infection via the tail vein. Infections were introduced via the tail vein with 1 × 10⁸ viral DNA equivalent virions in eight Hsd: Nu female and six male mice that had been pre-wounded according to our standard protocol. The injection sites were treated topically with an excess of neutralizing antibody (MPV.A4) immediately post injection to neutralize any virions remaining at the site. (A, C) The animals were monitored for tumour growth at pre-wounded cutaneous sites and (B, D) for viral DNA detection by qPCR at mucosal sites. (E) tongue, (F) vaginal, (G) anal, (all 20×), were positive for viral DNA by in situ hybridization (ISH, in blue). Interestingly, dysplasia was found in the penile tissue (H&E, H, 10×, arrow) that was positive for viral DNA by ISH (I, 10×, K, 20×), viral capsid protein L1 (L, 20×), and E4 protein (J, M, 20×) by immunohistochemistry.
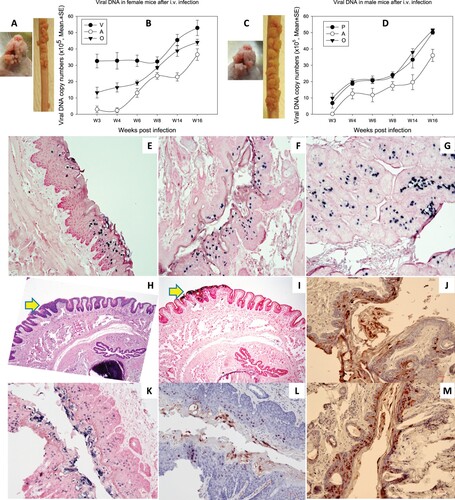
Figure 6. Three (two females and one male) of eleven tested mice were positive for virus infection in the stomach tissues. Representative stomach tissues were examined for histology. (A) Within the glandular stomach there is a focally extensive plaque lesion of mild to moderate hyperplasia with atypia. There is abundant hyperkeratosis (likely parakeratotic), with what appear to be crypt formation. There are occasional positive nuclei within the stratum spinosum and granulosum, with abundant positive staining of the cornified layers. There is multifocal cytoplasmic hybridization with parietal cells in the glandular stomach. (E) A small isolated (possibly pedunculated) focus of mild hyperplasia with cytologic and nuclear atypia (low grade) in the non-glandular stomach with scattered individual nuclear positive cells. These tissues were positive for viral DNA by in situ hybridization (ISH, B, F, 20×, in blue), viral capsid protein L1 (IHC, C, G, 20×, in red), and E4 protein (IHC, D, H, 20×, in red) by immunohistochemistry.
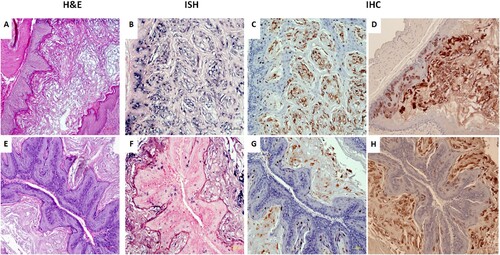
Figure 7. Blood of MmuPV1 infected mice with skin tumours was infectious at seven months post initial IV injection. Each naïve littermate transfused by IV injection of 0.2 mL of blood (<1 × 10⁴ viral copies) from two infected mice sacrificed seven months after initial IV MmuPV1 infection was examined weekly for tumour growth at the pre-wounded skin area. (A, B) Representative tumour growth (arrows) at the muzzle and the tail of naïve Hsd: Nu female (A) and male (B) mice at week sixteen post blood transfusion. Viral DNA was detected at the vaginal (V), anal (A) and oral (O) sites in three females (C, F1-F3) and the penile (P), anal (A) and oral (O) sites in three male (D, M1-M3) mice by qPCR. Mucosal sites of these mice (the vagina, anus, tongue, and penile) were positive for viral DNA by in situ hybridization (F, arrows, 20×, in blue). These tissues were positive for viral E4 protein (G, 20×, in red). One of the females was positive for viral DNA (ISH arrows, 60×, in blue) and viral capsid protein L1 (IHC, arrows, 60×, in red) in the stomach tissues (E).