Figures & data
Figure 1. ZIKV-induced viral production and cytotoxic effects in undifferentiated and differentiated hNPCs. Undifferentiated, D0- and D5-hNPCs were infected with the ZIKVAs or ZIKVAf strain, at MOI 0.5. Culture supernatants were collected from 24 hpi to 96 hpi to determine the viral titer and metabolic activity. Viral titers of the (A) ZIKVAs strain and (B) ZIKVAf strain in undifferentiated, D0- and D5-hNPCs were determined by standard plaque assay. Metabolic activity of undifferentiated, D0- and D5-hNPCs infected with the (C) ZIKVAs strain and (D) ZIKVAf strain were determined using Wst1 Cell Proliferation Assay. The percentage of infected cell metabolic activity was normalized to the mock-infected cells. Experiments were performed three times and the results represent mean fold increase ± standard error of the mean. Comparison between two groups was performed with a Student’s t-test with a P-value significant when *p < 0.05, **p < 0.01, ***p < 0.001.
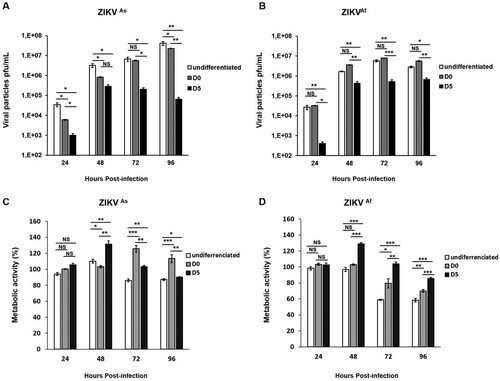
Figure 2. Distribution of cell populations in ZIKV-infected D0- and D5-hNPCs. Immunostaining of ZIKV infected hNPC in process of differentiation with antibodies directed against βIII-Tubulin (neuronal marker, red), GFAP (astrocyte marker, red) and 4G2 (Flavivirus marker, green) at 72 hpi, scale bar 100 µm. Nuclei were stained with DAPI (blue) (A). Distribution of absolute counts of neurons, astrocytes, hNPCs and total cells was determined within 10 independent squares of 0.2 mm2, using box plot (B). Comparison between two groups was performed with a Tuckey’s range test with a P-value significant when *p < 0.05, **p < 0.01, ***p < 0.001. The percentage of infected cells were manually determined based on virus markers (C). Comparison between two groups was performed with a Mann-Whitney test with a P-value significant when *p < 0.05, **p < 0.01, ***p < 0.001.
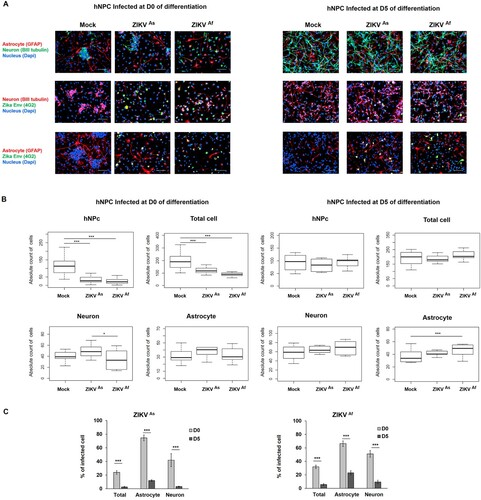
Figure 3. Modulation of innate immune gene expression by ZIKV in infected undifferentiated or D5-hNPCs. Total RNA from infected and uninfected hNPCs were analyzed for mRNA expression of PRRs, IFNs, ISGs, chemokines genes (A). Total RNA from uninfected hNPCs were analyzed for mRNA expression of IFNα/β receptor (IFNAR1) and IFNλ receptors (IL10Rβ and IL28Rα) (B). GAPDH was used as housekeeping gene for normalization. Experiments were performed three times and the results represent mean fold increase ± standard error of the mean. Comparison between two groups was performed with a Student’s t-test with a P-value significant when *p < 0.05, **p < 0.01, ***p < 0.001.
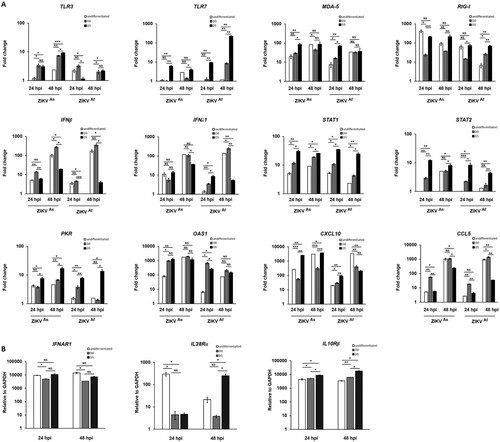
Figure 4. Innate immune response activation in undifferentiated or D5-ZIKV infected hNPCs. Expression of STAT2, pSTAT2, STAT1, pSTAT1, PKR, MX1, IFIT3 and NS5 was determined by Western blotting analysis in cell lysates of infected (24 and 48 hpi) and uninfected hNPCs. β-actin served as loading control. Results are representative of three independent experiments.
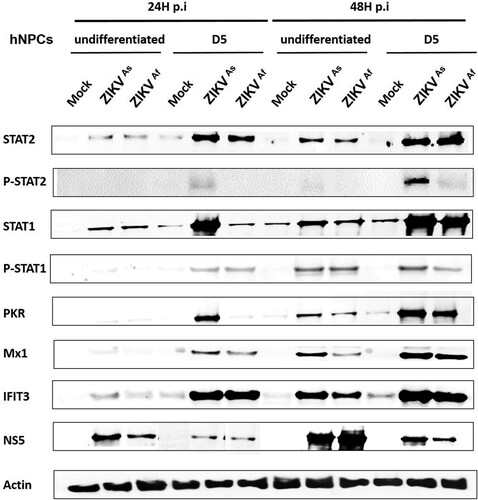
Figure 5. Neurogenesis RNA array analysis in ZIKV-infected hNPCs in the process of differentiation. Heatmap showing statistically significant up- (red) and downregulation (blue) of gene expression involved in neurogenesis pathways in ZIKVAs and ZIKVAf strain-infected hNPCs in process of differentiation, related to mock-infected cells at 24 and 48 hpi. Statistical analysis was performed using the RT2 profiler RT-PCR Array Data Analysis version 3.5.
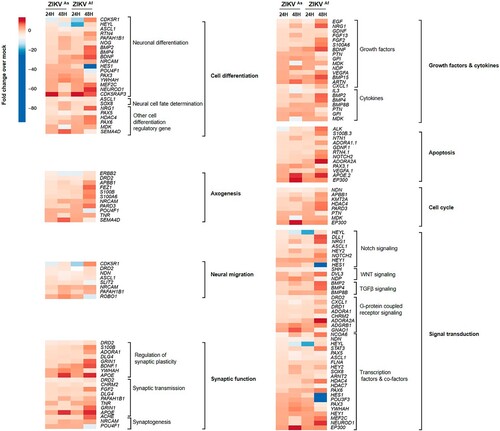
Figure 6. Western blot analysis of Notch pathway regulation in ZIKV infected D0-hNPCs and mouse brain. Cell lysates of mock or ZIKV-infected D0-hNPCs (A) and mock-(lines from 1 to 4) or ZIKVAs-infected (lines from 5 to 8) mouse brain samples (B) were analyzed for Notch1, cleaved Notch1, RBPSUH, MAML-1, C-myc, Cyclin-D3, P21, Hes1, NS5 and β-actin as loading control. Results are representative of three independent experiments.
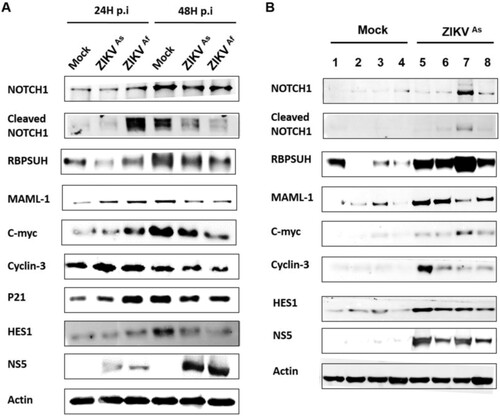
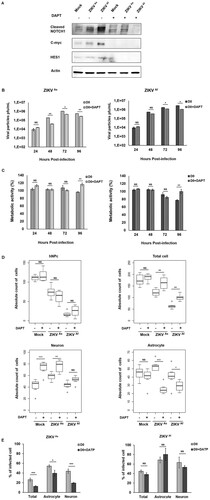
Figure 7. Notch inhibitor effect on ZIKV infectivity, cytotoxicity and cell differentiation in D0-hNPCs. Cell lysates of mock and ZIKV-infected D0-hNPCs treated with DAPT or untreated were analyzed for cleaved Notch1, C-myc and Hes1 (A). Distribution of absolute counts of neurons, astrocytes, hNPCs and total cells was determined within 10 independent squares of 0.2 mm2, using box plot (C). Comparison between DAPT treated and untreated cells was performed with a Tuckey’s range test with a P-value significant when *p < 0.05, **p < 0.01, ***p < 0.001. The percentage of infected cells were manually determined based on virus markers (C). Comparison between DAPT treated and untreated cells was performed with a Mann–Whitney test with a P-value significant when *p < 0.05, **p < 0.01, ***p < 0.001.