Figures & data
Figure 1. EBOV GP-specific IgG immune responses in immunized mice. (a) Chimpanzee adenoviral vaccine immunization and bleeding strategies in BALB/c mice. Six groups (n = 8) of BALB/c mice were i.m. injected with 2 × 10¹⁰ vp viruses. Blood samples were collected at different time points. (B) Kinetics of EBOV GP-specific total IgG reciprocal endpoints titres (log10) in 32 weeks post vaccination. Total IgG immune responses were measured by ELISA. (C) Anti-EBOV total IgG reciprocal endpoint titer (log10) of each immunized group at week 8 post vaccination. (D–F) represented EBOV GP-specific isotypes IgGs responses, IgG2a shown in (D), IgG2b shown in (E) and IgG1 shown in (F), all data were collected at week 8 post vaccination. The absorption values were detected at 450 nm. All data were displayed as mean ± SEM (standard error of mean). Significant differences were displayed as: NS, no significant differences;
*P < 0.05; **P < 0.01; ***P < 0.001.
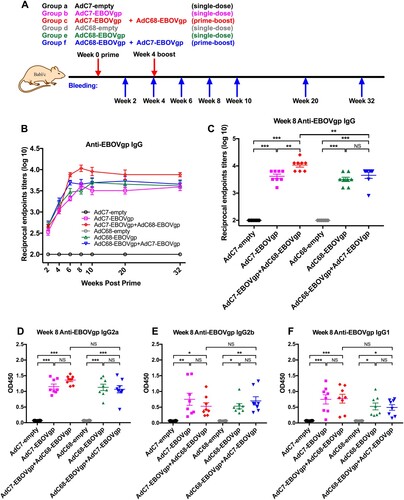
Figure 2. Neutralizing antibody responses in immunized mice. (A) Kinetics of EBOV GP specific neutralizing antibody responses NT50 in 32 weeks post vaccination. (B) NT50 responses of each immunized groups at week 8 post vaccination. (C) Correlation between NT50 titres and total IgG titres. Pearson’s correlation was applied in this analysis. All data were displayed as mean ± SEM. Significant differences were displayed as: NS, no significant differences;
*P < 0.05; **P < 0.01; ***P < 0.001.
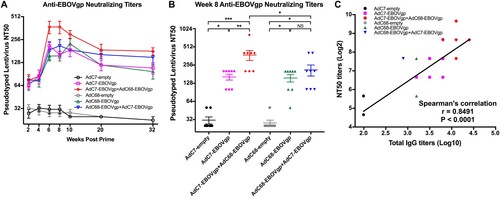
Figure 3. EBOV GP-specific T cell immune responses in immunized mice. Six groups (n = 5) of BALB/c mice were immunized with 2 × 10¹⁰ vp viruses via the i.m. injection. ELISPOT was performed to evaluate the ability of (A) PBMC and (B) splenocytes to secrete IFN-γ following stimulation with EBOV GP peptides pool at week 8 post immunization. All data were displayed as means ± SEM. Significant differences were displayed as: NS, no significant differences;
*P < 0.05; **P < 0.01; ***P < 0.001.
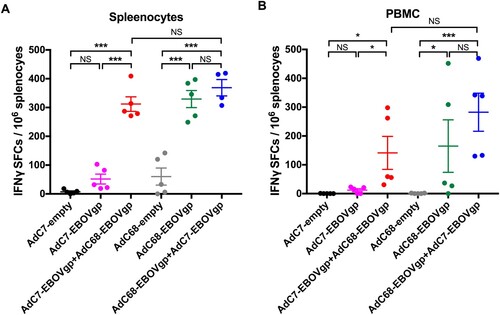
Figure 4. Protection against EBOVLP challenge in vaccinated mice. (A) Schematic diagram of EBOVLP challenge in mice. Six groups of BALB/c mice were immunized as described previously. After 12 weeks, EBOVLP was injected via i.v. route and in vivo imaging was performed 12 h post challenge. (B) In vivo bioluminescence signal images and (C) the measurement value of different murine groups were shown separately. The dotted line indicates the baseline, which is the bio-signal value of a non-immunized mouse. (D) Correlation between NT50 titres and bioluminescence signals of immunized mice. All data were displayed as mean ± SEM. Significant differences were displayed as: NS, no significant differences;
*P < 0.05; **P < 0.01; ***P < 0.001.
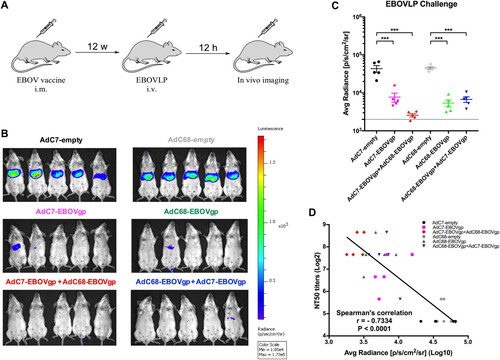
Figure 5. EBOV GP-specific antibody responses and chimpanzee Ad neutralizing antibody in rhesus macaques. (A) Five rhesus macaques were divided into two groups. Monkeys were primed with 5 × 10¹⁰ vp of AdC7-empty or AdC7-EBOVgp at week 0 and boosted with the same dose of AdC68-empty or AdC68-EBOVgp at week 4. Blood samples were collected at different time points. (B) Kinetics of EBOV GP specific total IgG reciprocal endpoints titers (log10) and (C) neutralizing antibody NT50 of monkeys at 24 weeks post-immunization were presented. Kinetics of (D) AdC7 and (E) AdC68 specific neutralizing activities of individual monkeys at 8 weeks post-immunization were presented. Empty 1 and Empty 2 represented two individual monkeys in the control group, while EBOVgp1, EBOVgp2, and EBOVgp3 represented three individual monkeys in the vaccine group.
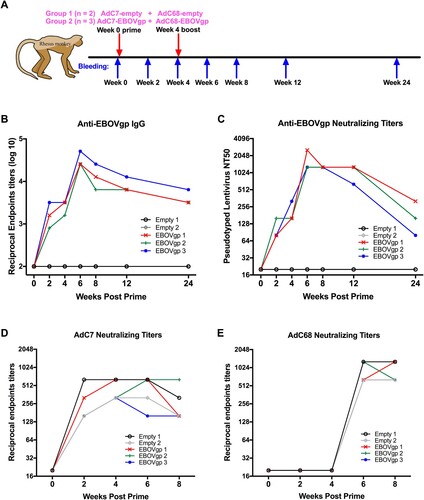
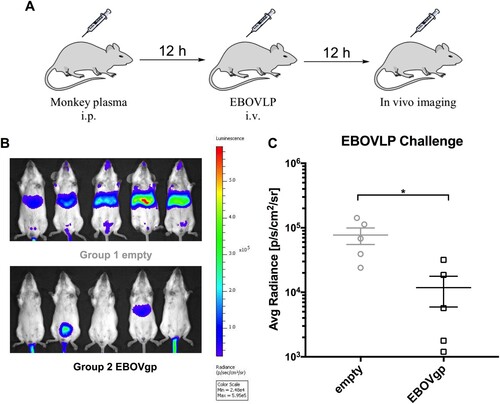
Figure 6. Antibodies from immunized rhesus macaques protected mice against EBOVLP. (A) Schematic diagram of EBOVLP challenge in mice. Two groups of mice received pooled plasma from vaccine and control monkeys via i.p. injection. After 12 h EBOVLP were injected into mice via i.v. route, and in vivo imaging was performed another 12 h post challenge. (B) In vivo bioluminescence signal images and (C) the measurement value of different murine groups were shown separately. All data were displayed as mean ± SEM. Significant differences were displayed as: NS, no significant differences;
*P < 0.05; **P < 0.01; ***P < 0.001.