Figures & data
Figure 1. Overlap between the acetylated peptides and proteins from four replicates in A. hydrophila. (A and B) Venn diagram showing the numbers of identified acetylated peptides and proteins, respectively.
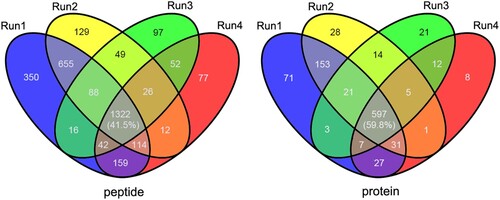
Figure 2. Bubble plot showing the enrichment for GO, KEGG pathway, and Pfam domain of acetyl-proteins. (A and B) GO classification of the identified acetylated proteins in terms of biological process and molecular function. (C) KEGG pathway-based enrichment analysis of acetylated proteins. (D) Pfam domain enrichment analysis of the identified proteins.
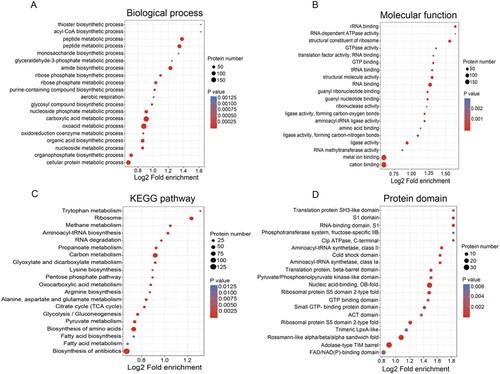
Figure 3. Protein–protein interaction networks in acetylated proteins. Six highly interconnected sub-networks in acetylated proteins were showed. They are carbon metabolism, ribosome, TCA cycle, pyrimidine metabolism, propanoate metabolism and fatty acid biosynthesis. The size of each circle reflects the number of acetylation sites.
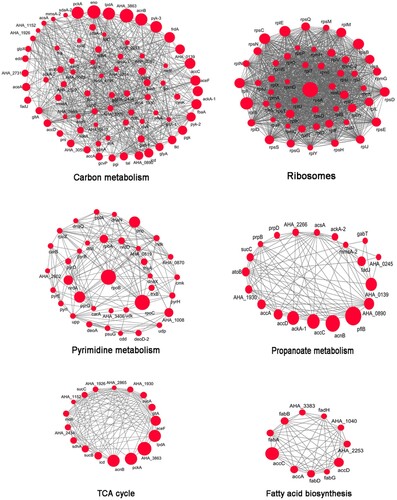
Figure 4. Validation by combining immunoprecipitation with Western blotting using anti-acetyl lysine antibodies. Left panel: Western blot analysis of target nine proteins. Middle panel: Western blot analysis for the Co-IP of whole-cell proteins with rabbit antisera to the nine proteins serving as a primary antibody and pre-immune serum used as the normal IgG. Right panel: Western blot of Co-IP samples using primary anti-acetyl lysine antibodies. The Kace represents lysine acetylation.
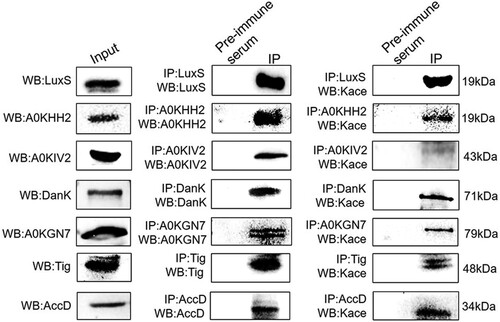
Figure 5. The KEGG pathway overlap between the lysine acetylome and succinylome in A. hydrophila. Venn diagram displaying the overlap number of peptides and proteins between both PTMs. The blue, green and red area shows the KEGG pathways associated with the overlapping, unique succinylated and unique acetylated proteins, respectively. The Kace and Ksuc represent lysine acetylation and succinylation, respectively.
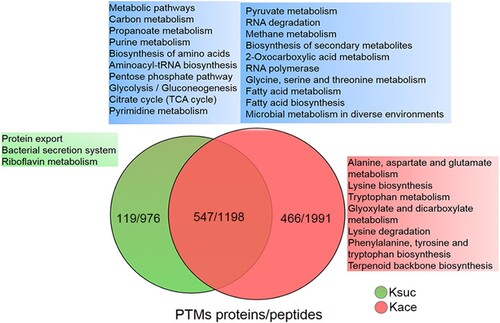
Figure 6. Schematic representation of lysine acetylation and succinylation in glycolysis/gluconeogenesis, TCA cycle, and pyruvate metabolism. The circle colour represents acetylation (blue), succinylation (green), or common PTMs sites (red), respectively.
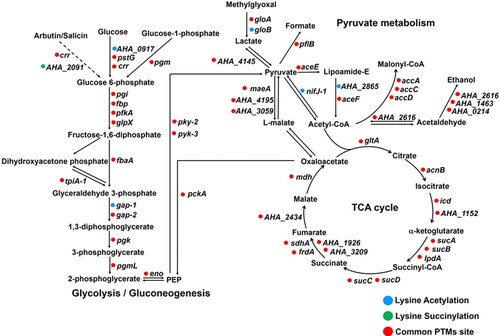
Figure 7. Lysine cross-talk between acetylation and succinylation at the K165 site of LuxS. (A) and (B) MS/MS spectra of acetyl and succinyl-peptides for the LuxS K165 site in A. hydrophila. (C) Lysine acetylation and succinylation modifications on LuxS sequence in A. hydrophila. (D) The LuxS site K165 PTMs in the rescued strain and site-directed mutants as detected by Western blotting combined with a pull-down assay using anti-acetyl and anti-succinyl antibodies, respectively. Kace, lysine acetylation; Ksuc, lysine succinylation.
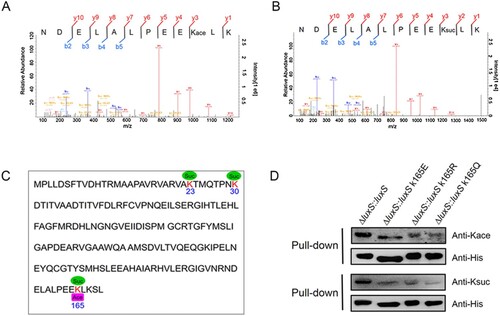
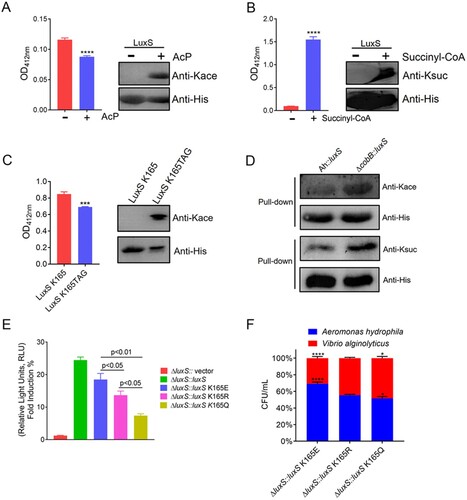
Figure 8. The PTMs cross-talk in LuxS influences its physiological functions and acylated by CobB deacetylase. (A) and (B) The enzymatic activity of the recombinant LuxS with in vitro acetylation and succinylation, and Western blot analysis using anti-acetyl lysine and anti-succinyl lysine, respectively. (C) The effect of site-specific acetylation occurred at K165 site of LuxS protein on the LuxS enzyme activity. Acetylation level of the site-specific acetylation occurred on K165TAG site of recombinant LuxS protein in E. coli was determined by Western blotting and the effect of the acetylated K165TAG site on LuxS enzyme was estimated by the enzyme activity. (D) The pull-down assay combined with Western blotting was utilized to detect CobB deacetylation and desuccinylation activity. Herein, Ah indicated the wild-type strain. (E) AI-2 production in the luxS mutant strains were determined using the V. harveyi bioluminescence assay. (F) A. hydrophila LuxS site-directed mutagenesis and its effect on bacterial fitness when competing with V. alginolyticus. Statistical analysis was performed using the One-way ANOVA, with each p-value showed in the bar graph. The Kace and Ksuc denote lysine acetylation and succinylation, respectively.