
Figures & data
Table 1. Antigenic analysis of A/Sw/2016 and A/Sw/2017 in HI test. Assay was started from first dilution 1/10. The “5” value indicates the absence of cross-reactivity between virus and antisera (below the first dilution).
Figure 1. Experimental infection of Balb/c mice by A/Sw/2016 influenza virus.
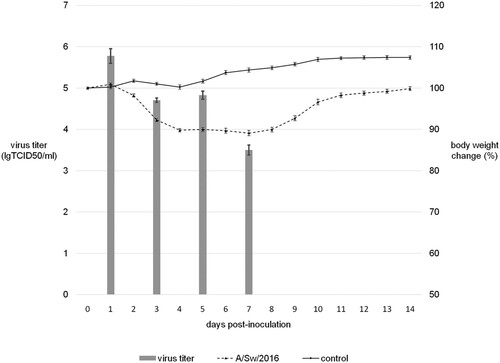
Table 2. Nucleotide identity of near homologs in GISAID to the influenza A(H1N1) strains A/Sw2016 and A/Sw2017.
Figure 2. Phylogenetic analysis of HA-gene of A/Sw2016 and A/Sw2017 (rhombuses). Circles – other Russian swine H1N1 viruses. Triangles – H1N1pdm09 virus vaccine strains. Each sequence is classified according to a Phylogeny-Based Global Nomenclature System and Automated Annotation Tool for H1 Hemagglutinin Genes from Swine Influenza A Viruses.
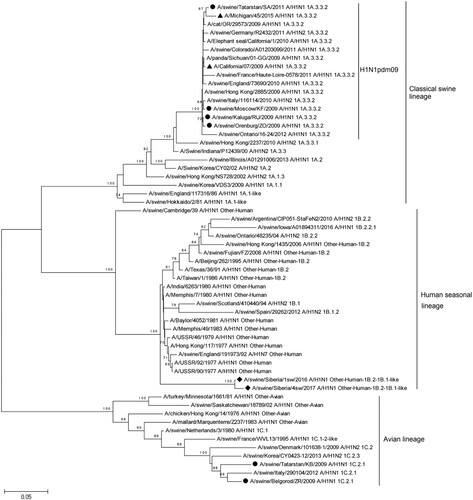
Figure 3. Phylogenetic analysis of NA-gene of A/Sw2016 and A/Sw2017 (rhombuses). Circles – other Russian swine H1N1 viruses. Triangles – H1N1pdm09 virus vaccine strains.
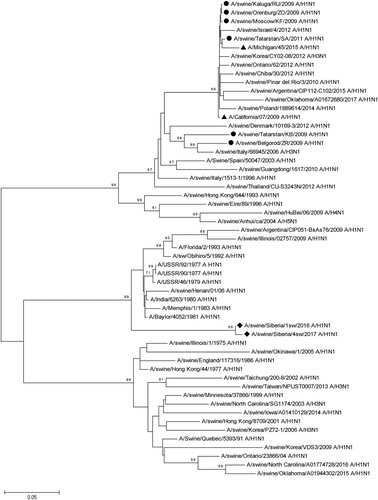
Table 3. Comparative analysis of the amino acid sequences of internal proteins between A/Sw2016 and A/Sw2017.
Supplemental material