Figures & data
Figure 1. Construction and characterization of CHIKV-iRFP. (A) Schematic representation of WT CHIKV and CHIKV-iRFP reporter viruses. An infectious cDNA clone of CHIKV was used as a backbone for the construction of CHIKV reporter virus. The expression of iRFP reporter gene was driven by a duplicate subgenomic (SG) promoter. Arrows represent SG promoters. (B) IFA analysis of viral E2 expression in BHK-21 cells transfected with in vitro transcribed genome-length RNAs of WT CHIKV and CHIKV-iRFP. (C) Plaque morphology of WT CHIKV and CHIKV-iRFP reporter viruses in BHK-21 cells. (D) Comparison of the growth kinetics of WT CHIKV and CHIKV-iRFP reporter viruses. The growth of WT CHIKV and CHIKV-iRFP were compared at an MOI of 0.01 in BHK-21 cells. Three independent experiments were performed in duplicate, and the representative data were presented. Error bars represent standard deviations. (E–G) Detection of the iRFP reporter gene during viral passage. Viral RNAs were extracted from the cells of P0 to P5 passage, respectively. RT-PCR was performed with a primer pair locating between the region of nsP4 and C. The numbers of time points-samples-passage were denoted on the top of each lane.
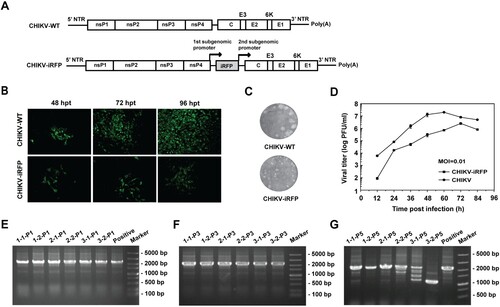
Figure 2. Correlation between fluorescence intensity and viral replication capability of CHIKV-iRFP. (A,B) In vitro correlation between fluorescence intensity and viral replication capability. BHK-21 cells in a 12-well plate were infected with CHIKV-iRFP at the 0.1, 0.5, 2.5 MOI, respectively. At 48 hpi, the plate was imaged (A), and the culture media were collected and subjected to plaque assay. Fluorescence radiant efficiency quantified by Living Image software was plotted against viral titre in the culture media (B). (C,D) In vivo correlation between fluorescence intensity and viral replication capability. One-day-old BALB/c mice were infected through i.c. injection with the indicated doses of CHIKV-iRFP. Representative images from three mice were shown at 24 hpi using IVIS Spectrum instrument equipped with 675/30 nm excitation and 720/20 nm emission filters. The colour bar indicates the fluorescence radiant efficiency (C). Total fluorescence radiant efficiency of the head areas of the iRFP expressing mice was plotted against inoculation dose (D).
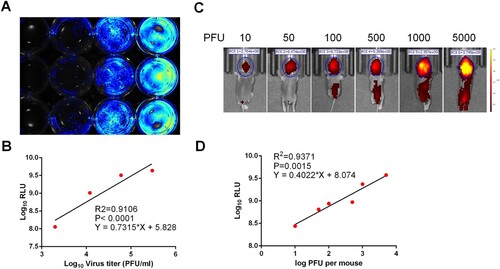
Figure 3. Age-dependent replication in suckling BALB/c mice. (A) Time-course whole-body fluorescence images in suckling BALB/c mice at different ages. Suckling BALB/c mice (n = 5 or 6) of indicated ages were infected through i.c. injection with CHIKV-iRFP (104 PFU) diluted in 20 μl of DMEM and were imaged at the indicated time points. (B) Total fluorescence radiant efficiency of the head areas of the iRFP expressing mice in (A) was quantified using Living Image software. (C) Survival curve of the iRFP expressing mice in (A). (D) Time-course body weight changes in suckling mice in (A).
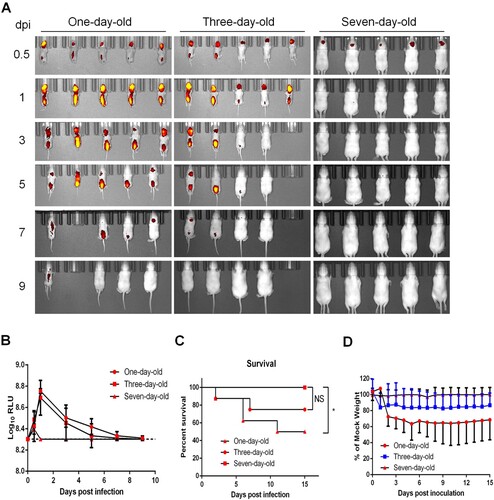
Figure 4. Virulence of CHIKV-iRFP and the parental CHIKV. Four-week-old A129 mice (n = 8) were infected through i.c. injection with CHIKV-iRFP or CHIKV (103 PFU) diluted in 20 μl of DMEM and were monitored daily for 7 days to assess morbidity and mortality. Log-rank (Mantel-Cox) test was performed (*p < 0.05).
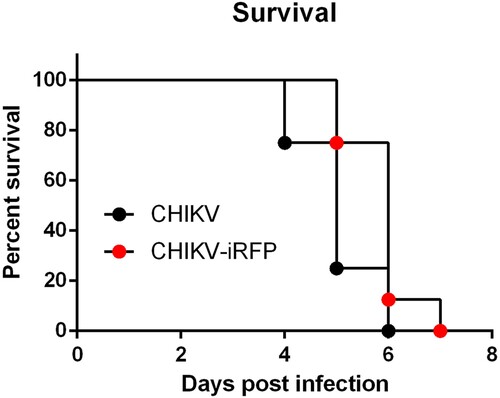
Figure 5. In vivo imaging of CHIKV-iRFP dynamics and localization. (A) Viral dynamics and localization in infected A129 mice. A129 mice were infected through left footpad with CHIKV-iRFP (103 PFU) diluted in 50 μl of DMEM and imaged at the indicated time points with head fur removed using a depilatory cream. (B) Fluorescence signals of mice in (A) were quantified using Living Image software. (C) The skeletons were imaged after euthanasia of dying mice. (D) Fluorescence signals of mice in (C) were quantified using Living Image software. (E) Bone marrow cells were harvested from CHIKV-iRFP, CHIKV and mock infected A129 mice after euthanasia and IFA was performed on the bone marrow smears using anti-CHIKV polyclonal antibody. (F) A129 mice were euthanized at 5 dpi and tissues were isolated and homogenized. Plaque assays were performed to quantify viral load in tissues.
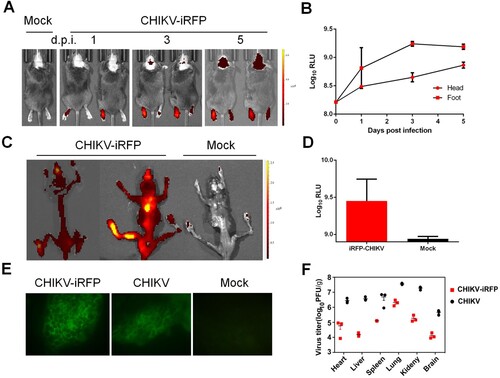
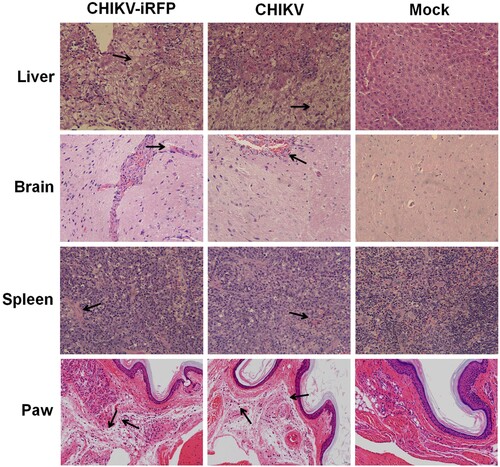
Figure 6. Histology of tissue sections from mice infected with CHIKV and CHIKV-iRFP. The tissues (liver, brain, spleen and paw) from the mice infected with CHIKV-iRFP, WT CHIKV or PBS were collected at 5 dpi and then stained via the haematoxylin and eosin method (H&E) 400X. The arrows indicated the typical histological lesions in the detected tissues.