
Figures & data
Table 1. Kinetic parameters of PNGM-1 and five PNGM-1 mutants for various β-lactams.
Figure 1. Characteristics of subclass B3 MBL PNGM-1. (A) Neighbor-joining phylogenetic tree of PNGM-1 with all MBL types (B1, B2, and B3 MBL subclasses) and structurally representative enzymes of MBL fold proteins that have diverse functions but no β-lactamase activity. Only bootstrap values higher than 50% are shown. Bar, 0.2 substitutions per amino acid site. (B) Multiple sequence alignment of PNGM-1 with representative sequences of B1, B2, and B3 MBLs and MBL fold proteins. The unique metal-binding motif, HXHXDH, is well conserved in subclass B3 MBLs including PNGM-1 and MBL fold proteins, and is indicated with a box. The closed triangle shows the difference between subclass B2 (CphA and SFH-1) and others, with the differing residues highlighted in blue, while the closed square shows the difference between B1 and B2 MBLs (NDM-1, VIM-1, IMP-1, CphA, and SFH-1) and others, with the differing residues highlighted in green. The closed circles highlight residues which are conserved in all MBLs and MBL fold proteins. Accession numbers of all enzymes used for phylogenetic analysis are listed in Table S3.
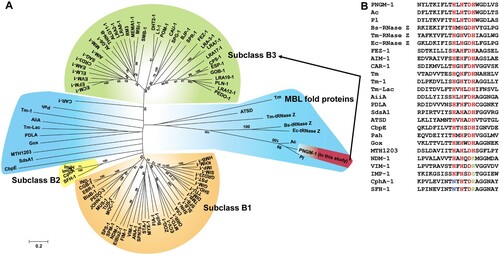
Figure 2. Gradual structural changes of tRNase Zs, PNGM-1 and subclass B3 MBLs. The structure of PNGM-1 [subunit A (red) and B (yellow), PDB entry 6J4N] was compared with those of tRNase Z from B. subtilis [Bs-tRNase Z (purple/green), PDB entry 4GCW], T. maritima [Tm-tRNase Z (orange/orange), PDB entry 2E7Y], and E. coli [Ec-tRNase Z (cyan/cyan), PDB entry 2CBN] and subclass B3 MBLs from P. aeruginosa [AIM-1 (blue), PDB entry 4AWZ], Elizabethkingia meningoseptica [GOB-18 (pale green), PDB entry 5K0W], and Legionella gormanii [FEZ-1 (lime), PDB entry 5W90]. The tRNA-bound Bs-tRNase Z structure was superimposed on the structures of the enzyme compared and the superimposed tRNA was presented with the enzymes (top row). In all structures, the 3’ end position of superimposed tRNA was bound in the substrate-binding pocket (bottom row). The substrate-binding pocket is marked with a red dashed line.
![Figure 2. Gradual structural changes of tRNase Zs, PNGM-1 and subclass B3 MBLs. The structure of PNGM-1 [subunit A (red) and B (yellow), PDB entry 6J4N] was compared with those of tRNase Z from B. subtilis [Bs-tRNase Z (purple/green), PDB entry 4GCW], T. maritima [Tm-tRNase Z (orange/orange), PDB entry 2E7Y], and E. coli [Ec-tRNase Z (cyan/cyan), PDB entry 2CBN] and subclass B3 MBLs from P. aeruginosa [AIM-1 (blue), PDB entry 4AWZ], Elizabethkingia meningoseptica [GOB-18 (pale green), PDB entry 5K0W], and Legionella gormanii [FEZ-1 (lime), PDB entry 5W90]. The tRNA-bound Bs-tRNase Z structure was superimposed on the structures of the enzyme compared and the superimposed tRNA was presented with the enzymes (top row). In all structures, the 3’ end position of superimposed tRNA was bound in the substrate-binding pocket (bottom row). The substrate-binding pocket is marked with a red dashed line.](/cms/asset/d321c677-4108-41dc-b72b-e5369a08df20/temi_a_1692638_f0002_oc.jpg)
Figure 3. In vitro assays for RNase activity of PNGM-1 on total human cell RNA. Total RNA (0.3 μg) of the human cell line KMM-1 was incubated with or without 15 μM PNGM-1 in the presence of 10 mM MgCl2 (A) or MnCl2 (B), at 37°C for 60 min, and analyzed by microfluidics-based automated electrophoresis. Input RNA without PNGM-1 in the absence of any additional metal ions is shown in (C). An electropherogram and a gel image for each sample are shown. The peaks around 22 and 25 s denote the 25-nt marker (green line on the gel image) and approximately 100-nt RNAs including tRNA, 5S rRNA, and 5.8S rRNA, respectively. 18S, 18S rRNA (pink line); 28S, 28S rRNA (blue line); FU, arbitrary fluorescence units; RIN, RNA integrity number. Experiments in (A)-(C) were repeated at least three times and were reproducible.
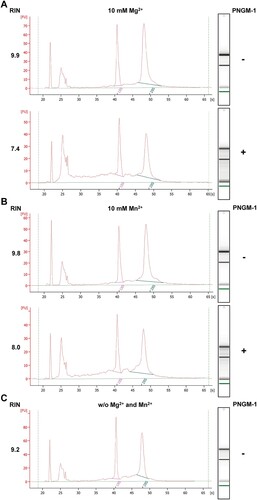
Figure 4. In vitro assays for RNase activity of PNGM-1 on small unstructured RNA substrates. (A) The 5′-6-carboxyfluorescein-labeled substrates (usRNA1, usRNA9, and usDNA1) were incubated with PNGM-1, and the products were analyzed on either a 20% polyacrylamide 8 M urea gel or a 20% polyacrylamide native gel. The native gel was used only for analysis of usDNA1 reactions with MnCl2. (B) The substrates were incubated with 15 μM PNGM-1 in the presence of 10 mM MgCl2 at 50°C for 30, 60, and 90 min. (C) The substrates were incubated with 3, 9, and 15 μM PNGM-1 in the presence of 10 mM MgCl2 at 50°C for 90 min. (D) The substrates were incubated with 15 μM PNGM-1 in the presence of 10 mM MgCl2 at 25, 37, 50, and 80°C for 90 min. (E) The substrates were incubated without (−) or with (+) 15 μM PNGM-1 in the absence or presence of 5–50 mM MgCl2 or MnCl2 at 50°C for 90 min. Experiments in (B–E) were repeated at least three times and were reproducible.
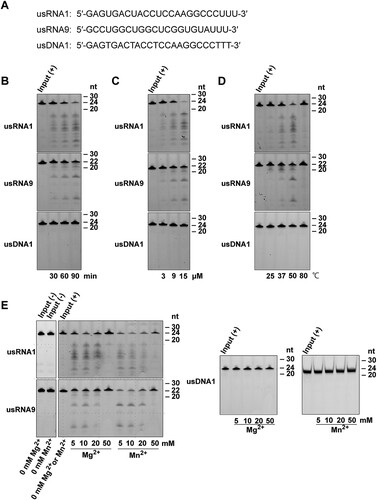
Figure 5. In vitro RNA cleavage assays for PNGM-1 mutants. usRNA1, usRNA9, and usDNA1 were incubated with 15 μM wild-type PNGM-1 or PNGM-1 mutant (H91A, H93A, H96A, H257A, or D95A) in the presence of (A) 10 mM MgCl2 or (B) MnCl2, at 50°C for 90 min, and the products were analyzed on a 20% polyacrylamide 8 M urea gel or a 20% polyacrylamide native gel. The native gel was used only for analysis of usDNA1 reactions with MnCl2. WT, wild type. Experiments in (A) and (B) were repeated at least three times and were reproducible.
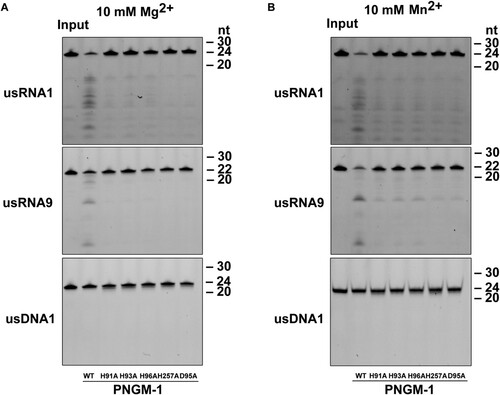
Figure 6. Cleavage site analysis for the RNA substrates usRNA1 and usRNA9 (A and B); and pre-tRNA processing assay (C and D). (A) usRNA1 and (B) usRNA9 were incubated at 50°C in the presence of 10 mM MgCl2 with 15 μM PNGM-1 for 90 min or in the presence of 10 mM MnCl2 with 1.5 μM Tm-tRNase Z for 30 min. Cleavage products were analyzed on a 20% polyacrylamide 8 M urea gel. Arrows indicate the major cleavage sites. (C) The secondary structure of human pre-tRNAArg and cleavage sites for human Δ30 tRNase ZL, Tm-tRNase Z, and PNGM-1. (D) The 84-nt 5′-fluorescein-labeled human pre-tRNAArg was incubated with 0.5 μM human Δ30 tRNase ZL in the presence of 10 mM MgCl2 at 37°C for 30 min, with 1.5 μM Tm-tRNase Z at 37°C for 60 min or with 15 μM PNGM-1 at 50°C for 90 min. The products were analyzed on a 20% polyacrylamide 8 M urea gel. Experiments in (A)–(D) were repeated at least three times and were reproducible.
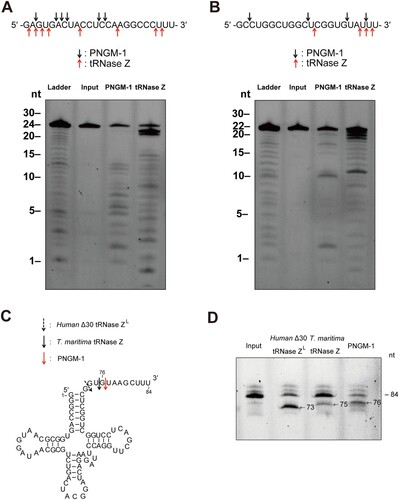
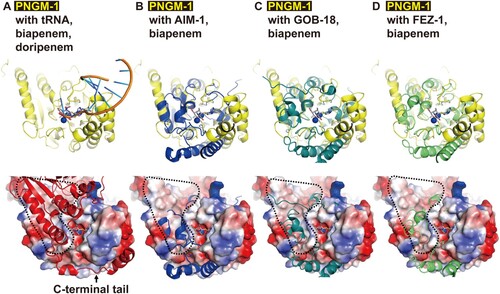
Figure 7. Structural comparison of PNGM-1 with subclass B3 MBLs. The structure of PNGM-1 (yellow) was superimposed with those of AIM-1 (blue, PDB entry 4AWZ), GOB-18 (pale green, PDB entry 5K0W), and FEZ-1 (lime, PDB entry 5W90) (top row). (A) PNGM-1 structure with superimposed tRNA, biapenem, and doripenem. (B) PNGM-1 structure with superimposed AIM-1 and biapenem. (C) PNGM-1 structure with superimposed GOB-18 and biapenem. (D) PNGM-1 structure with superimposed FEZ-1 and biapenem. The surface electrostatic potential of PNGM-1 (subunit A) is shown (bottom row). Structures of PNGM-1 (subunit B, red), AIM-1, GOB-18, and FEZ-1 are shown in cartoon representation. The main dimerization surface of PNGM-1 is marked with a black dashed line.
Supplemental Material
Download Zip (2.5 MB)Data availability
Coordinates for the PNGM-1 atomic model have been deposited in the Protein Data Bank under the accession codes 6J4N (native) and 6JKW (SeMet).