
Figures & data
Figure 1. Mutation spectrum of YFV-17D and PLLAV following infection in AG129 mice. (A) Schematic presentation of study design. AG129 mice were inoculated i.p. with either a range of inocula of YFV-17D; 10−2–10−1 PFU, or 104 PFU of YFV-17D (n = 3/group) or with 20 µg of PLLAV (n = 7). Mice brains were harvested and homogenized for plaque purification prior to sequencing. (B) Mutation frequencies in brain-derived YFV-17D and PLLAV following neurotropic infection in AG129 mice.
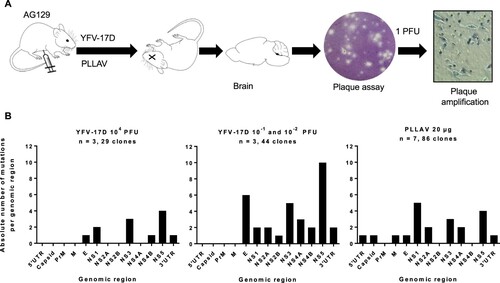
Table 1. Nucleotide substitutions per genomic region of YFV-17D versus PLLAV
Figure 2. Mutation patterns observed in YFV-17D infected mice. (A) Graphical presentation of genomes of 73 brain-derived, plaque-purified virus clones of YFV-17D following i.p. inoculation and neuroinvasion in AG129 mice (n = 6). (B) Graphical presentation of 86 similar virus clones following i.p. injection of 20 µg of PLLAV-YFV17D and neuroinvasion in AG129 mice (n = 7). Horizontal blue lines represent individual YFV-17D genomes with blue circles as 5’ and 3’ UTRs, respectively. Red, green and orange diamonds represent missense, silent and mixed mutations, respectively (mixed = parental + mutant nucleotide). For a full list of mutations see Supplementary Tables S4 and S5.
Figure 3. Diversity of virus variants in brains of mice inoculated with YFV-17D and PLLAV. (A) Hamming distances calculated for 104 PFU [high inoculum] (n = 3, 29 clones), 10−1 PFU + 10−2 PFU [low inoculum] (n = 3, 44 clones) of YFV-17D, and PLLAV (n = 7, 86 clones). (B) Hamming distances computed for each virus inoculum. (C) The Shannon entropy and (D) Simpson’s index of diversity for each inoculum. Data for PLLAV are from 2 independent experiments (n = 3 each), bars presented median values. Student t-test for statistical comparison between groups.
![Figure 3. Diversity of virus variants in brains of mice inoculated with YFV-17D and PLLAV. (A) Hamming distances calculated for 104 PFU [high inoculum] (n = 3, 29 clones), 10−1 PFU + 10−2 PFU [low inoculum] (n = 3, 44 clones) of YFV-17D, and PLLAV (n = 7, 86 clones). (B) Hamming distances computed for each virus inoculum. (C) The Shannon entropy and (D) Simpson’s index of diversity for each inoculum. Data for PLLAV are from 2 independent experiments (n = 3 each), bars presented median values. Student t-test for statistical comparison between groups.](/cms/asset/023ab4f2-f8f1-4c73-ad72-0eb015a02e39/temi_a_1694394_f0003_oc.jpg)
Figure 4. Evolutionary analysis and diversity of YFV-17D before and after inoculation in AG129 mice. (A) Diversity in plaque-purified virus clones (n = 20) of Stamaril® (lot H5105) prior to injection in mice. A consensus sequence (Stamaril® P0) was generated from 20 plaque-purified virus clones. Evolutionary analysis in MEGA X [Citation36] using Maximum Likelihood method and Kimura 2-parameter model [Citation51]. Tree by Neighbor-Join and BioNJ algorithms to a matrix of pairwise distances (Maximum Composite Likelihood estimates), selecting the topology with superior log likelihood value (−15353.23). Branch lengths drawn to scale (scale bar: 0.0020 substitutions per site). The analysis involved n = 21 nucleotide sequences, including GenBank X03700 as reference genome, with a total of 10862 positions in the final dataset. (B) Graphical visualization of genetic diversity and segregation observed in YFV-17D populations following neurotropic infection in AG129 mice.
![Figure 4. Evolutionary analysis and diversity of YFV-17D before and after inoculation in AG129 mice. (A) Diversity in plaque-purified virus clones (n = 20) of Stamaril® (lot H5105) prior to injection in mice. A consensus sequence (Stamaril® P0) was generated from 20 plaque-purified virus clones. Evolutionary analysis in MEGA X [Citation36] using Maximum Likelihood method and Kimura 2-parameter model [Citation51]. Tree by Neighbor-Join and BioNJ algorithms to a matrix of pairwise distances (Maximum Composite Likelihood estimates), selecting the topology with superior log likelihood value (−15353.23). Branch lengths drawn to scale (scale bar: 0.0020 substitutions per site). The analysis involved n = 21 nucleotide sequences, including GenBank X03700 as reference genome, with a total of 10862 positions in the final dataset. (B) Graphical visualization of genetic diversity and segregation observed in YFV-17D populations following neurotropic infection in AG129 mice.](/cms/asset/a0cb111e-093f-4956-b1f1-62ae63e6bcc2/temi_a_1694394_f0004_oc.jpg)
Figure 5. Phylogenetic tree of Stamaril® and PLLAV-derived YFV-17D clones from AG129 mice. Coloured dots represent the different inocula. Green: PLLAV 20 µg; blue dots: 104 PFU Stamaril; yellow: 10−1 PFU Stamaril; red: 10−2 PFU Stamaril: purple: consensus sequence (P0) of Stamaril®. Evolutionary history inferred using the Neighbor-Joining method [Citation52]. The optimal tree (sum of branch length = 0.00785397) drawn to scale. Evolutionary distances (in number of base substitutions/site) computed using the Kimura 2-parameter method [Citation17], involving n = 162 nucleotide sequences (n = 10862 positions in the final dataset after pairwise deletion of ambiguous positions).
![Figure 5. Phylogenetic tree of Stamaril® and PLLAV-derived YFV-17D clones from AG129 mice. Coloured dots represent the different inocula. Green: PLLAV 20 µg; blue dots: 104 PFU Stamaril; yellow: 10−1 PFU Stamaril; red: 10−2 PFU Stamaril: purple: consensus sequence (P0) of Stamaril®. Evolutionary history inferred using the Neighbor-Joining method [Citation52]. The optimal tree (sum of branch length = 0.00785397) drawn to scale. Evolutionary distances (in number of base substitutions/site) computed using the Kimura 2-parameter method [Citation17], involving n = 162 nucleotide sequences (n = 10862 positions in the final dataset after pairwise deletion of ambiguous positions).](/cms/asset/b90e36d3-101e-485f-88de-10ba96baffba/temi_a_1694394_f0005_oc.jpg)