
Figures & data
Figure 1. Chronology for all Ebola virus disease (EVD) outbreaks. The primary case results from zoonotic spillover and leads to a period of undetected transmission. It is typically determined retrospectively with epidemiological investigations. The index case is the first case to be recognized and marks the official beginning of an outbreak. The final case includes the 42-day observation period. Colours around numbers indicate the following groupings of outbreaks by spillover date: 1976–2012, west Africa (2013), 2014–2018, and ongoing DRC (2018). Locations in parentheses are reported outbreak spillover locations. *For the 1977 DRC (Bonduni) outbreak, the primary case, index case, and final case are the same.
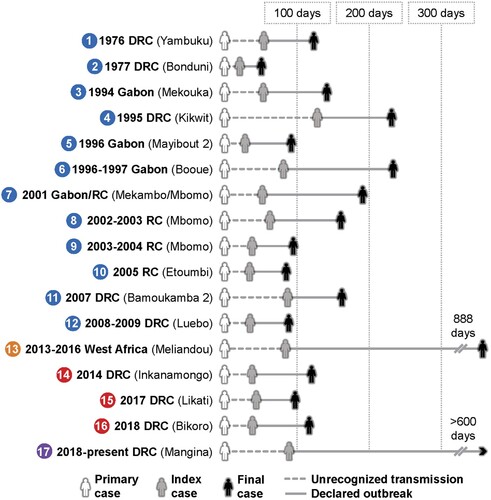
Figure 2. Location and spread of all currently described outbreaks of Ebola virus disease. Zoonotic spillover location per outbreak is indicated by circles with numbers. Numbers inside circles represent the order of the 17 spillovers from 1976-present correspond to Figures 1. For the 2001–2002 Gabon/Republic of Congo outbreak, which had multiple spillovers suspected, only the first spillover location is indicated. *Primary transmission zone; outbreaks 1, 6, 7, and 13 had distant case spread that is not shown in this figure; see .
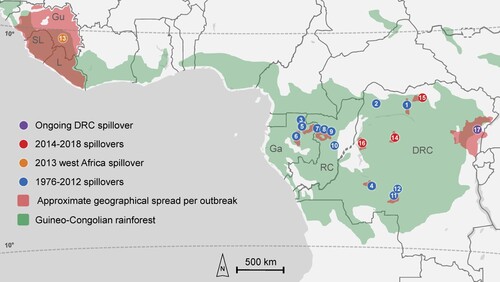
Figure 3. Transmission of Ebola virus (EBOV) in Ebola virus disease (EVD) outbreaks compared to virus transmission in other zoonotic viral hemorrhagic fevers. EVD outbreaks usually result from exclusively human-to-human transmission following a single zoonotic spillover to a primary EVD case. Outbreaks of other zoonotic viral hemorrhagic fevers are often characterized by sustained spillover from a reservoir/intermediate host and limited human-to-human transmission. *Other filovirus diseases (e.g. Marburg virus disease) follow a similar pattern to EVD.
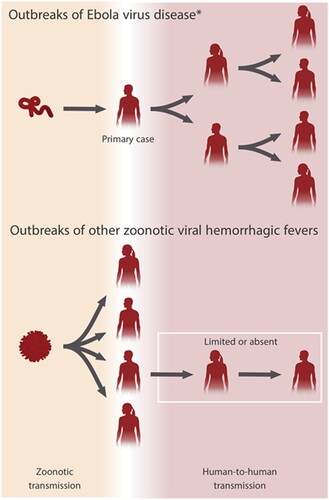
Figure 4. Median Ebola virus disease (EVD) outbreak metrics and correlations of outbreak duration and size to the initial period of undetected transmission. (A) Median time elapsed (dashed line) from primary case to index case and total days with interquartile range (bars) for all EVD outbreaks. (B) Median cases (dashed line) with interquartile range (bars) for all EVD outbreaks. (C) Correlation of time elapsed from suspected primary case to index case to outbreak duration for all EVD outbreaks. (D) Correlation of time elapsed from suspected primary case to index case to total cases for all EVD outbreaks.
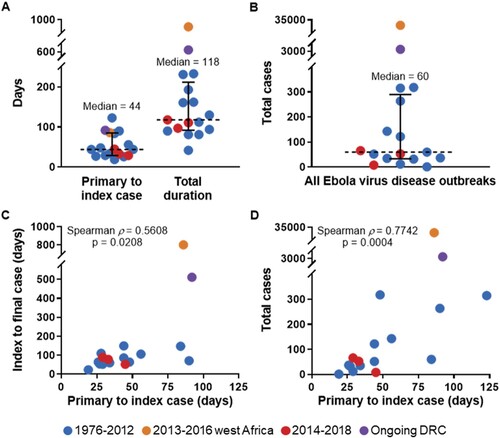
Table 1. EVD outbreaks with transmission and/or case(s) treated >150 km beyond primary transmission zone.
Figure 5. Cases and vaccinations for west Africa and the ongoing DRC Ebola virus disease outbreaks, and overall case fatality rate (CFR) for all EVD outbreaks. (A) Total cases (suspected, probable, confirmed) are included for the 2013–2016 west Africa Ebola virus disease (EVD) outbreak and the ongoing EVD outbreak in the Democratic Republic of the Congo and plotted by week. For vaccinations in west Africa, all vaccine platforms that were utilized are included; in the current DRC outbreak, Merck's V920 (rVSVΔG-ZEBOV-GP) accounts for most vaccinations; as of 24 December 2019, 2938 doses of the Johnson & Johnson Ad26.ZEBOV/MVA-BN-Filo have been administered. Beginning dates represented are 26 December 2013 and 30 April 2018 for the west Africa outbreak and the ongoing DRC outbreak, respectively. (B) Comparison of CFR for EVD cases during the following periods: 1976–2012, west Africa (2013–2016), 2014–2018, and the ongoing outbreak in the Democratic Republic of the Congo (2018-present). For west Africa, basic care is that which patients received in Ebola treatment units; advanced care is that which patients received when treated in the US or Europe. Grey and orange checkered colouring indicate that the CFR for the west Africa outbreak range from the naïve calculated 40% to recent corrected estimates of 63% [Citation19] and 83% [Citation44]. Numbers above bars indicate total number of cases represented. *As of 24 December 2019.
![Figure 5. Cases and vaccinations for west Africa and the ongoing DRC Ebola virus disease outbreaks, and overall case fatality rate (CFR) for all EVD outbreaks. (A) Total cases (suspected, probable, confirmed) are included for the 2013–2016 west Africa Ebola virus disease (EVD) outbreak and the ongoing EVD outbreak in the Democratic Republic of the Congo and plotted by week. For vaccinations in west Africa, all vaccine platforms that were utilized are included; in the current DRC outbreak, Merck's V920 (rVSVΔG-ZEBOV-GP) accounts for most vaccinations; as of 24 December 2019, 2938 doses of the Johnson & Johnson Ad26.ZEBOV/MVA-BN-Filo have been administered. Beginning dates represented are 26 December 2013 and 30 April 2018 for the west Africa outbreak and the ongoing DRC outbreak, respectively. (B) Comparison of CFR for EVD cases during the following periods: 1976–2012, west Africa (2013–2016), 2014–2018, and the ongoing outbreak in the Democratic Republic of the Congo (2018-present). For west Africa, basic care is that which patients received in Ebola treatment units; advanced care is that which patients received when treated in the US or Europe. Grey and orange checkered colouring indicate that the CFR for the west Africa outbreak range from the naïve calculated 40% to recent corrected estimates of 63% [Citation19] and 83% [Citation44]. Numbers above bars indicate total number of cases represented. *As of 24 December 2019.](/cms/asset/474a811c-d50b-49bb-83ca-06ccd38e9cc7/temi_a_1722036_f0005_oc.jpg)