Figures & data
Figure 1. Morphologies of mating projections and opaque filaments of C. albicans. To induce mating projections, opaque cells (1 × 10⁷ cells/mL) were incubated in liquid Lee’s medium and treated with 50 μM α-factor at 25°C for 6 or 24 h. To induce filaments, opaque cells were incubated in SOR medium overnight at 25°C. (A) Transmission electron microscope (TEM) images. Scale bar, 2 µm. p, projection; f, filamentation; v, vacuole; s, septum; ns, no septum. (B and C) Calcofluor White and DAPI staining assays. Scale bar, 10 µm. White arrows, septum. p, projection; f, filamentation. (D) Diagrams of opaque cells, mating projections, and opaque filaments.
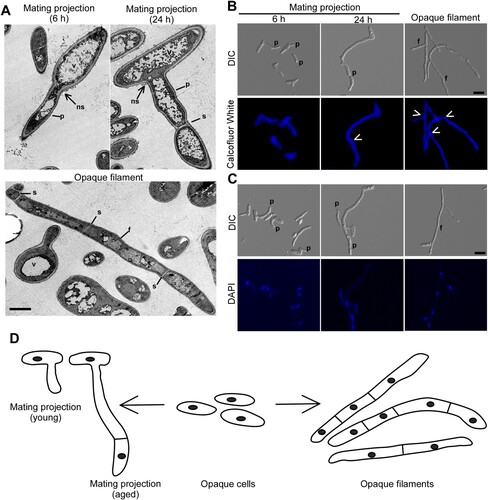
Figure 2. Ectopic expression of MTLα1 promotes mating projection formation in “a” cells of C. albicans. (A) Ectopic expression of MTLα1 in “a” cells. pNIM1, plasmid containing a doxycycline-controlled TETon promoter. Percentages of mating projection cells are indicated in the corresponding images. Black arrows indicate mating projections. (B) Relative expression levels of mating and pheromone-response genes in the control (WTa + pNIM1) and MTLα1-ectopically expressing strains (WTa + pNIM1-MTLα1) in Lee’s glucose medium with or without 40 μg/mL doxycycline (Dox). Error bar, standard deviation (SD). *P < 0.05, **P < 0.01 (Student’s t-tests, two tailed). (C) Ectopic expression of MTLα1 in “a” cells induces the secretion of α-factor. An MFA1p-GFP reported strain served as a reporter for detecting the secretion of α-factor. Scale bar, 10 µm. (D) MFα1 and its receptor Ste2 are required for the development of mating projection induced by ectopic expression of MTLα1. Scale bar, 10 µm. Diagram of MTLα1-induced mating projection formation in “a” cells. Ectopic expression of MTLα1 in “a” cells induces the secretion of α-factor. α-Factor then binds to its receptor Ste2 and activates the mating response signalling pathway and mating projection formation through an auto-feedback mechanism.
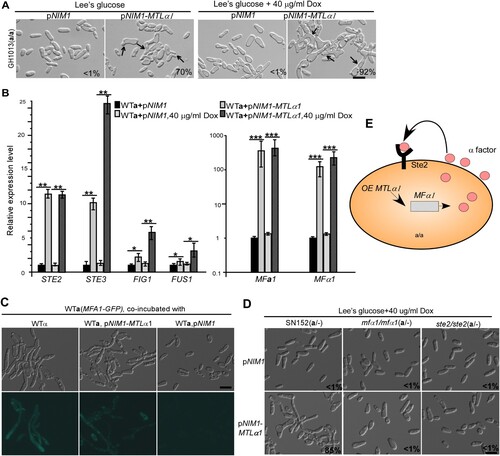
Figure 3. Development of mating projections in the mutants of the mating response signalling pathway. (A) Schematic diagram of the MAPK-mediated mating response signalling pathway in C. albicans. (B) Ectopic expression of MTLα1 in the mutants of the mating response signalling pathway. Opaque cells of C. albicans (1 × 10⁷ cells/mL) were cultured in liquid Lee’s medium containing 40 μg doxycycline at 25°C for 24 h. Percentages of mating projection cells are indicated in the corresponding images. Scale bar, 10 µm.
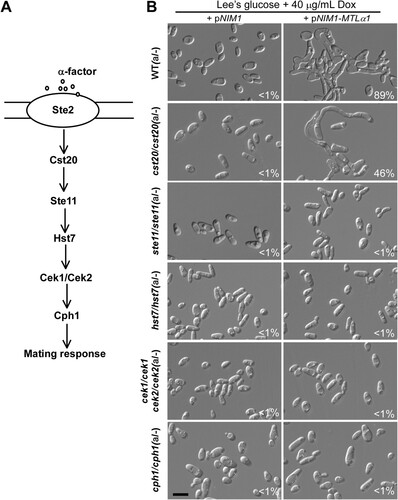
Table 1. Mating efficiencies of the null mutants of C. albicans.
Figure 4. Role of the Ras-cAMP/PKA signalling pathway in the development of mating projections. (A) Diagram of the Ras-cAMP/PKA signalling pathway in C. albicans. (B) Ectopic expression of MTLα1 in the mutants of the Ras-cAMP/PKA signalling pathway. Opaque cells of C. albicans (1 × 10⁷ cells/mL) were cultured in liquid Lee’s glucose or Lee’s GlcNAc (only for the flo8/flo8 mutant) medium containing 40 μg/mL doxycycline at 25°C for 24 h. Percentages of mating projection cells are indicated in the corresponding images. Scale bar, 10 µm.
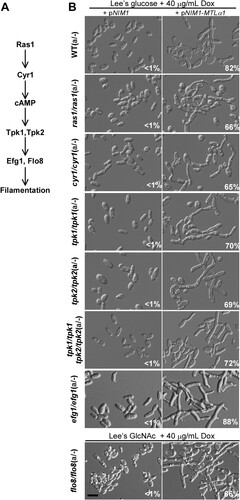
Figure 5. Roles of Ume6, Hgc1, Tec1, and Cbk1 in the regulation of the formation of mating projection. (A) Ectopic expression of MTLα1 in the MTLa/- mutants of ume6/ume6, hgc1/hgc1, tec1/tec1, and cbk1/cbk1. Opaque cells of C. albicans (1 × 10⁷ cells/mL) were cultured in liquid Lee’s glucose medium containing 40 μg/mL doxycycline at 25°C for 24 h. Scale bar, 10 µm. (B) Treatment of the cbk1/cbk1 and cbk1/cbk1 + pACT-WOR1 strains with 50 μM α-factor. The cbk1/cbk1 + pACT-WOR1 strain is a WOR1-overexpressing (opaque-locked) strain. Opaque cells of the two strains were treated with α-factor and incubated at 25°C for 24 h. Scale bar, 10 µm. Percentages of mating projection cells are indicated in the corresponding images.
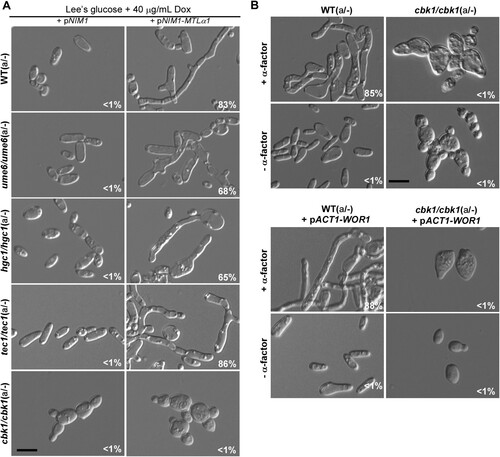
Figure 6. Role of the RAM pathway in the development of mating projections. (A) Diagram of the RAM pathway in C. albicans. (B) Ectopic expression of MTLα1 in the RAM pathway mutants. Opaque cells of the mutants (1 × 10⁷ cells/mL) were cultured in Lee’s glucose medium containing 40 μg/mL doxycycline at 25°C for 24 h. Scale bar, 10 µm.
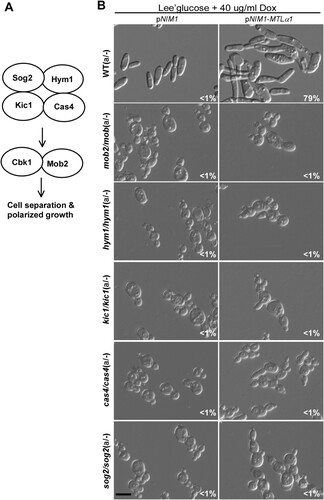
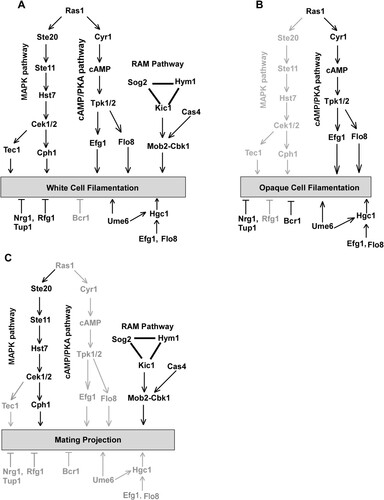
Figure 7. Genetic regulation of white cell filamentation (A), opaque cell filamentation (B), and mating projection formation (C) in C. albicans. The cAMP/PKA pathway is required for filamentous growth in both white and opaque cells, but is not required for the development of mating projections. The Ste11-Hst7-Cek1/2-mediated MAPK pathway is essential for the development of mating projections. This pathway plays a critical role in white cell filamentation but is not required for opaque cell filamentation. The RAM pathway is essential for the development of mating projections and white cell filamentation. Its role in opaque cell filamentation remains to be investigated. The Bcr1 transcription factor controls filamentous growth in opaque cells but is not involved in the regulation of mating projection formation and white cell filamentation. Ume6, Efg1, Flo8, and Hgc1 are important regulators of filamentous growth in both white and opaque cells but are not required for the development of mating projections.