Figures & data
Figure 1. Construction and characterization of infectious clone-derived EV71. (A) Scheme of the cDNA constructs of EV71. A T7 promoter was flanked to the 5′ of the viral genome and a ployA (A30) was added to the 3′ of the viral genome. A Hind III site was added behind the polyA sequence. (B–D) RD cells were infected with EV71 695F virus stock (EV71-parent) and infectious clone-derived EV71 (EV71-clone) at MOI of 0.1. (B) At the indicated time points, the supernatants were collected and the virus titre was determined in Vero cells and plotted (n = 2). (C) Representative plaque morphology. (D) Representative infected cell lysates were analyzed by western blotting with anti-EV71 VP1 and anti-β-actin antibodies. (E) Vero cells were infected with EV71 695F virus stock (EV71-parent) and infectious clone-derived EV71 (EV71-clone) at MOI of 0.1. At 1 days post infection, the cells were fixed and immune-stained with anti-EV71 VP1 antibody, after counterstain-stained with DAPI and observed with confocal microscopy.
Figure 2. Infection of mouse with infectious clone-derived EV71. (A–C) Three-day-old ICR mice were infected with EV71 695F virus stock (EV71-parent) and infectious clone-derived EV71 (EV71-clone) at a dosage of 1.4 × 10⁴ pfu per mouse by intraperitoneal (i.p.) injection. Or the mice were infected with PBS (Mock). (A) The body weight of mice in different days after infection. All mice dead in EV71-Clone group from 9 days post infection (Mean ± SD, n = 10; *EV71-Clone and EV71 parent P < 0.01; # Mock and EV71 parent P < 0.01; two-tailed, unpaired t-test). (B) The mortality of mice (n = 10). (C) Representative paralysis symptoms of foetal mice at day 5 post infection. (D–F) Three-day-old Balb/C and C57 mice were infected with infectious clone-derived EV71 at a dosage of 1.4 × 10⁴ pfu per mouse by intraperitoneal (i.p.) injection as described above. (D) The body weight of mice in different days after infecting EV71-clones. All mice dead in C57 group from 8 days post infection. All mice dead in BALB/c group from 9 days post infection (Mean ± SD, n = 10, #BALB/c P < 0.01; *C57 P < 0.01; two-tailed, unpaired t-test). (E) The mortality of mice (n = 10). (F) Representative paralysis symptoms of foetal mice at day 5 post infection.
Figure 3. Amino acid sequence alignment of the open reading frames of EV71 strains. The amino acid sequence of 540v/vNM/05 (accession number, JQ965759), MP4 (accession number, JN544419) and Isehara/Japan/99 (accession number, LC375764) and EV71-js1 were analyzed by MegAlign (DNAstar) and the amino acid variations were denoted. Unique amino acid variations are in red. The asterisks indicate the modified or mouse-adapted variations. The E145 in VP1 are in bold.
Figure 4. Infectivity of the EV71 bearing a single cell-culture-derived mutation. (A) Scheme of the cDNA constructs of EV71 and mutants. There is a glutamic acid at residue 145 of VP1 in the wild type (WT) sequence whereas a glycine at the same residue in the mutated sequence (Mutant). (B) The growth curves of EV71-VP1.145E and EV71-VP1.145G viruses. Vero cells were infected with viruses at MOI of 0.1. The supernatants were collected at indicated time points and the viral titres were determined by plague assay at duplicates in Vero cells and the titres were plotted (n = 2). (C) The plaque morphology of EV71-VP1.145E and EV71-VP1.145G virus in the infected Vero cells. (D–E) Three-day-old ICR mice were infected with infectious clone-derived EV71-VP1.145E and EV71-VP1.145G at a dosage of 1.4 × 10⁴ pfu per mouse by intraperitoneal (i.p.) injection as described above. (D) The body weight of mice in different days after infection. All mice dead in EV71-VP1.145E group from 9 days post infection. (Mean ± SD, n = 10. *EV71-VP1.145E and EV71-VP1.145G P < 0.01; two-tailed, unpaired t-test). (E) The mortality of mice (n = 10).
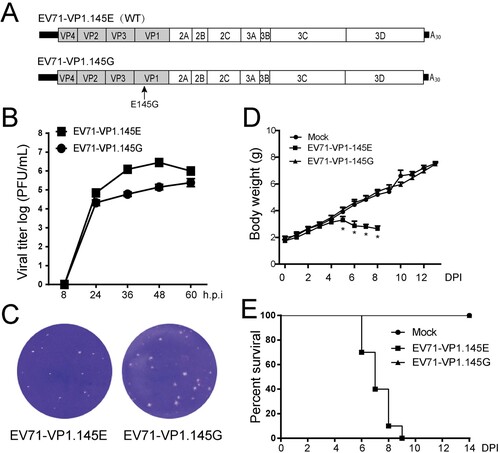
Figure 5. Characterization of EV71.VP1.145G virus. (A) Scheme of the cDNA constructs of EV71.Nluc reporter virus. Nluc, Nanoluciferase. The wild type (WT, 145E) and the mutant (145G) residue 145 of VP1 are shown. The 3C protease inactivated mutation C147A is shown. (B-C) The growth curves of EV71.Nluc reporter virus. (B) Vero cells were infected with EV71 (EV71-VP1.145E) and EV71-Nluc (EV71-Nluc-VP1.145E) viruses at a MOI of 0.1. At indicated time points, the viruses in the supernatants were tittered by plague assay (n = 2). (C) The plaque morphology of EV71-VP1.145E and EV71-Nluc-VP1.145E virus in infected Vero cells. (D) Schematic of the experiment design for E to H. The RNAs of EV71-Nluc-VP1.145E, EV71-Nluc-VP1.145G and EV71-Nluc-3C-147A were transfected into Vero cells. The supernatants were collected at the indicated time points and the luciferase activity was determined. The virus tittering in the supernatants collected at 24 h post transfection (h.p.t) were determined. And the supernatants were used to re-infect naïve Vero cells, and at various time points, the luciferase activity in the supernatants of the re-infected cells were determined. (E) Luciferase activity in the supernatants at various time points after transfection (Mean ± SD, n = 3). AU, arbitrary light units. (F) Virus titres in the supernatants collected at 24 h post transfection. (n = 2). (G) Representative plaque morphology of EV71-Nluc-VP1.145E and EV71-Nluc-VP1.145G. (H) Luciferase activity in the supernatants of the re-infected cells (Mean ± SD, n = 3). AU, arbitrary light units. From E to H, similar results were obtained at another independent experiment.
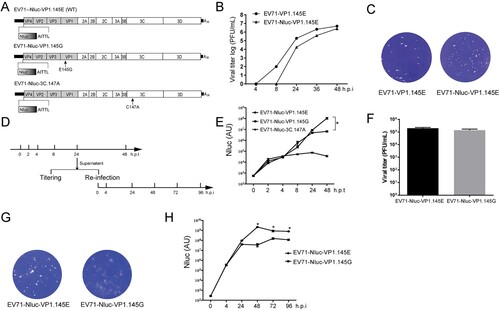
Figure 6. Pathology of EV71-infected mice. (A) ICR mice were infected with EV71-VP1.145E and EV71-VP1.145G as described above. Mice were sacrificed on day 5 post infection when the sickness of mice matched the third clinical graded score (see material and methods). Different tissues were fixed and paraffin-embedded sections were performed haematoxylin and eosin (H&E) staining. White scale bars are shown. In the muscle tissue, the black arrows indicate the myolysis; the green arrow indicates cells without complete myolysis. In the Lung tissue, the arrows indicate widened alveolar septum; the asterisks indicate diminished alveolar spaces. (B) Tissue tropism of EV71. Viral RNAs in different tissues were quantified by quantitative real-time PCR (Mean ± SD, n = 5) (*P < 0.05; two-tailed, unpaired t-test).
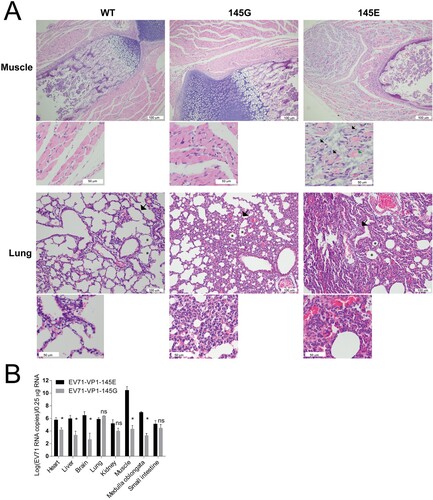
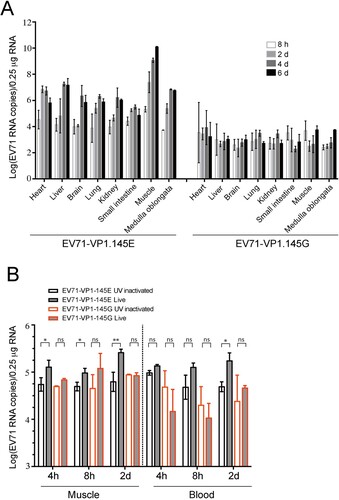
Figure 7. Viral dynamics in EV71-infected mice. (A) ICR foetal mice were infected with EV71-VP1.145E and EV71-VP1.145G viruses as described above and sacrificed at various time points after infection. Different tissues were isolated and the viral levels were determined by qPCR (Mean ± SD, n = 5). (B) ICR foetal mice were infected with EV71-VP1.145E and EV71-VP1.145G viruses or UV-inactivated counterparts. At indicated time points after infection, the viral RNA levels in blood and leg skeletal muscle were determined (Mean ± SD, n = 5) (*P < 0.05; **P < 0.01; two-tailed, unpaired t-test).