Figures & data
Figure 1. Persistent and resolved HPgV-2 infection. Two patients HCV19 (A, B) and HCV49 (C, D) from the HCV/HIV-1 co-infection cohort were followed for up to 240 weeks. Changes of viral RNA for HCV (circle, detection limit is 17 copies/ml by Cobas quantification) and HPgV-2 (square, detection limit is 750 copies/ml by RT-PCR) as well as anti-HPgV-2 antibody (triangle, cut-off value=0.2) were analysed and shown in the left panels. Levels of ALT (circle), AST (square) and CD4/CD8 ratio (triangle) were depicted in the panels to the right. The two patients received interferon and ribavirin therapy for 48 weeks and antiretroviral therapy as indicated in gray rectangles.
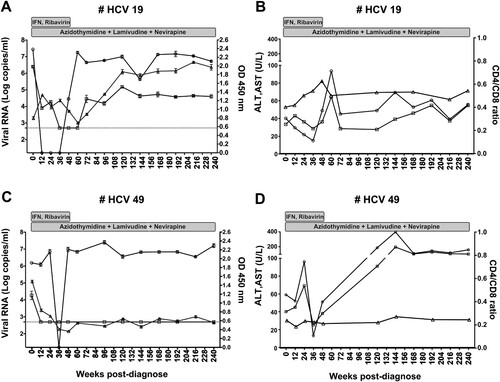
Figure 2. Clinical course of patients co-infected with HCV and HPgV-2. Changes in viral RNA for HCV (circle, detection limit is 17 copies/ml by Cobas quantification) and HPgV-2 (square, detection limit is 750 copies/ml by RT-PCR) as well as anti-HPgV-2 antibody (triangle, cut-off value=0.2) are presented in panels A, C, and E; Values for ALT (circle), AST (square) and Fibroscan score (triangle) are shown in panels B, D, and F. Patient HCV121 was followed from May 2015 to July 2019. During April and November 2018, bicyclol tablets were administered to improve liver function. Beginning in November 2018, DAAs (400 mg Sofosbuvir and 100 mg Velpatasvir) were administered for a period of 24 weeks. Patient JX18052 was co-infected with HCV and HPgV-2 and was treated with DAAs (Sofosbuvir + Daclatasvir) for 12 weeks. Both patients were followed up for another 12 weeks after termination of DAA treatment.
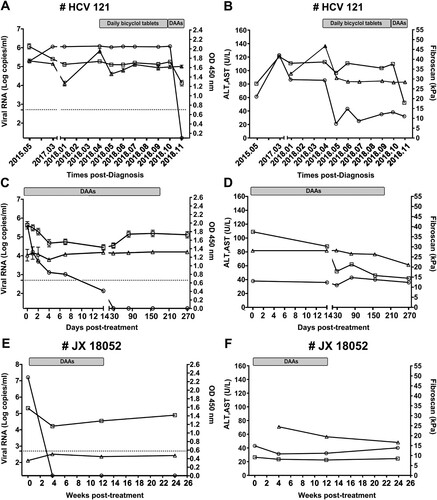
Table 1. Baseline characteristics of the patients co-infected with HCV and HPgV-2.
Figure 3. HE staining of liver slices showing representative pathological changes in patients HCV121 (A, B) and JX18052 (C, D) co-infected with HCV and HPgV-2. Before treatment (A, C), there was a large amount of lymphocyte infiltration in the portal tract and lymphoid follicles containing germinal centers (a, i); damaged bile ducts and hyperplasia of bile ducts in the portal tract (b, j); and macrovesicular steatosis (c, k). The interface was destroyed by lymphocyte infiltration and inflammation (d, l). After DAA treatment (B, D), there were fewer lymphocyte infiltrates in the portal tract (e, m); moderate bile duct hyperplasia in the portal tract (f, n); less macrovesicular steatosis in hepatocytes (g, o); and moderate interface inflammation (h, p).
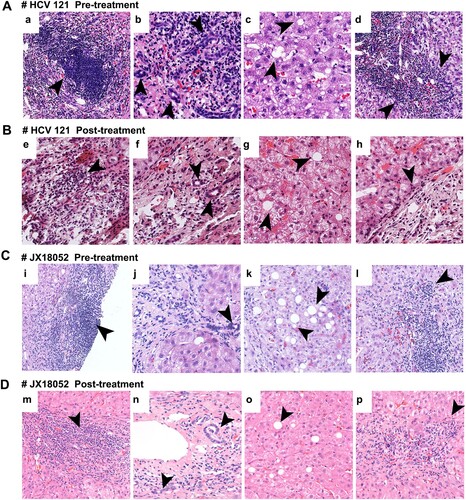
Figure 4. Detection of HPgV-2 antigen in liver tissues. Immunohistochemical (IHC) staining of liver biopsies was performed for HCV/HPgV-2 co-infected patients HCV121 (A) and JX18052 (B), using anti-HPgV-2 NS5A antibody as the primary antibody; HPgV-2 antigens were specifically stained brown in the infiltrative lymphocytes, but not in the hepatocytes. No specific signals were observed in the HCV positive, HPgV-2 negative patient (C). The negative control was stained using PBS to replace the primary antibody, anti-HPgV-2 (D).
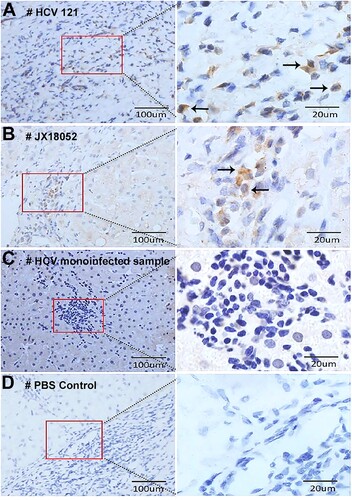
Figure 5. Detection of HPgV-2 and HCV RNA in liver tissues using RNAscope in situ hybridization. Liver slices were collected from HCV and HPgV-2 co-infected patients: patient HCV121 before DAA treatment (A) and patient JX18052 after DAA treatment (B). The specific probes for host gene POLR2A and PPIB were used as positive controls (a, e). For patient HCV121, HCV RNA (green) was detected in hepatocytes (b) and infiltrative lymphocytes (c), while HPgV-2 RNA (red) was only found in infiltrative lymphocytes (c). For patient JX18052, HPgV-2 RNA was detected in the infiltrative lymphocytes (g), but not in the hepatocytes (f). Non-specific probes were used as the negative controls (d, h). The size of the bar is 20 µm.
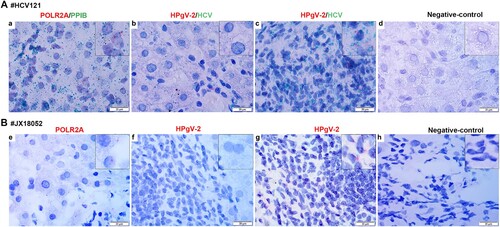
Figure 6. Detection of HPgV-2 and HCV in PBMCs using Fluorescent in situ Hybridization (FISH). Specific probes for the positive and negative-strand RNAs of HCV and HPgV-2 were end-labeled with TAMRA (red) and FAM (green), respectively. Before DAAs treatment, PBMCs from HCV and HPgV-2 co-infected patients HCV121 (A) and JX18145 (B) were hybridized with the labeled probes. (C) PBMCs from healthy volunteers were used as the negative control. The nucleus was stained with 1% DAPI (blue). The size of the bar is 20 µm.
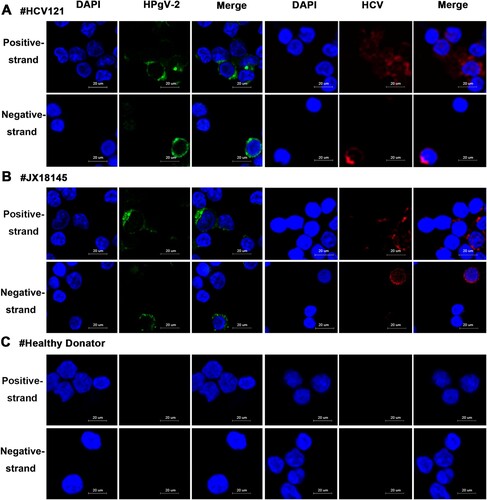
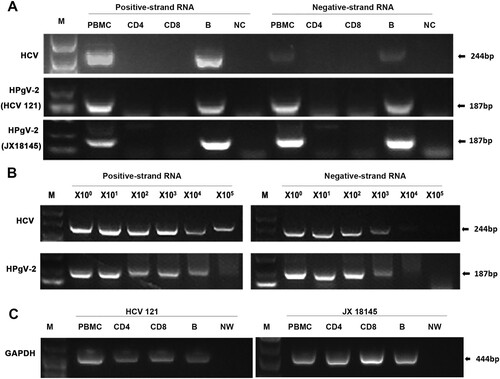
Figure 7. Amplification and detection of HPgV-2 and HCV positive- and negative-strand RNAs in PBMCs. CD4+ and CD8+ T lymphocytes as well as B cells were isolated with more than 90% purity using flow cytometry from HPgV-2 and HCV RNA positive patients HCV121 and JX18145. Total RNA was extracted from 2–4 × 10⁶ cells and amplified by RT-PCR for HCV and HPgV-2 (A). To measure virus replication efficiency within B cells, a semi-quantitative approach was used to quantify RNA levels by analysing 10-fold serial dilutions of the 1st round PCR products in the 2nd round PCR (B). The housekeeping gene GAPDH DNA was amplified in parallel and served as a control (C). M, Marker. NW, negative control using water; NC, negative control using PBMCs from healthy volunteer.