Figures & data
Figure 1. Illustration of nucleotide (A) and amino acid (B) sequence alignments of the S1/S2 junction regions of wild type SARS-CoV-2 (Wuhan-1), 30-bp deleted mutant (Del-mut-1) (EPI_ISL_417443) and the bat coronavirus, RaTG13 [Citation5]. (C) Sizes of WT and Del-mut-1 PCR product on agarose gel amplified with the primers described in the Materials and Methods section.
![Figure 1. Illustration of nucleotide (A) and amino acid (B) sequence alignments of the S1/S2 junction regions of wild type SARS-CoV-2 (Wuhan-1), 30-bp deleted mutant (Del-mut-1) (EPI_ISL_417443) and the bat coronavirus, RaTG13 [Citation5]. (C) Sizes of WT and Del-mut-1 PCR product on agarose gel amplified with the primers described in the Materials and Methods section.](/cms/asset/e779457c-21c7-4216-acb8-9f8bd769083f/temi_a_1756700_f0001_oc.jpg)
Figure 2. (A) Growth properties of Del-mut-1 and WT viruses in Vero-E6, A549, Caco-2 and Calu-3 cells. (B) Detection of Del-mut-1 variant in clinical specimens (n = 26) and different passages of Del-mut-1 variant in Vero-E6 cells. (C) Pathogenicity of WT and Del-mut-1 in hamsters. Bodyweight changes of hamsters (four in each group) infected with WT or Del-mut-1 strains of SARS-CoV-2 virus. Two animals from each group were euthanized on day 2 post-infection (dpi) for the examination of histopathology and virus titers in respiratory tract tissues, and the remainder on day 4 post-infection. Error bars represent mean ± s.d. (n = 4 per group for days 0–2, n = 2 per group for days 3–4).
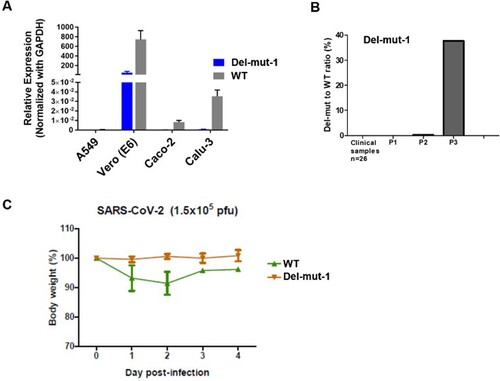
Figure 3. Histopathological analysis of lung tissues from hamsters infected with either WT or Del-mut SARS-CoV-2 virus. Lung tissues were collected on days 2 (A: a, b, e, f) and 4 (B: c, d, g, h) post-infection and processed for HE staining. Images a & b (Del-mut-1, 2 dpi) are representative images showing diffuse alveolar wall thickening, perivascular oedema, and blood vessel and alveolar-capillary congestion involving about 70% of the lung section cutting area. Bronchiolar epithelial cell swelling and a mild degree of desquamation are indicated by arrows in panel b. No infiltration or exudate was observed in the alveolar space. Image c (Del-mut virus, 4 dpi) shows diffuse alveolar wall thickening and peribronchiolar infiltration. The bronchiolar epithelial layer also shows a mild degree of desquamation (arrow). Image d shows detached epithelial cells mixed with mononuclear cells and red blood cells in the lumen of bronchioles. Image e (WT virus, 2 dpi) shows diffuse alveolar wall thickening and peribronchiolar infiltration, with a mild degree of desquamation of the bronchiolar epithelial layer (arrow). Image f shows detached epithelial cells mixed with mononuclear cells, red blood cells in the lumen of bronchiole (solid arrow), alveolar space haemorrhage and mild exudate and cell infiltration. These changes involved about 70% of the lung section cutting area. Image g (WT virus, 4 dpi) shows diffuse alveolar collapse (solid circle) and proline-rich exudates (dashed circle) and a focal area of lung consolidation (arrow). Image h (WT virus, 4 dpi) shows alveolar wall destruction, alveolar space haemorrhage and mononuclear cell infiltration (arrow). Scale bar: 500um (images a, c, e, g), 50um (images b, d, f, h).
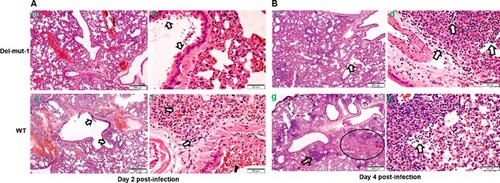
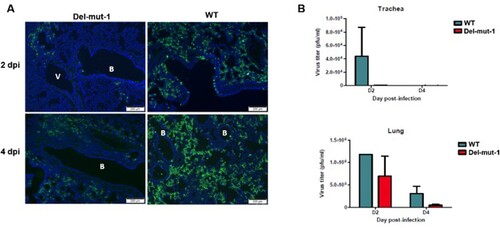
Figure 4. Virus replication in the lung tissues of hamsters infected with either WT or Del-mut-1 SARS-CoV-2 virus. (A) Indirect immunofluorescence assay with antibodies against the N protein of SARS-CoV-2 virus (green). Blue: DAPI staining of cell nuclei. B: bronchiole, V: blood vessel. (B) Virus titration by plaque assay of lung and tracheal tissues collected on day 2 and 4 post-infection. Error bars represent mean ± s.d. (n=2 per group for each timepoint) Scale bar, 200 µm, dpi: days post-infection.