Figures & data
Table 1. Basic information of COVID-19 patients.
Figure 1. The seropositive rates of N and S specific IgM and IgG antibody responses in non-ICU patients after symptom onset. A. The changes in seropositive rates of N-IgM, N-IgG, S-IgM and S-IgG in 27 non-ICU patients. B. The changes in seropositive rates of N-IgM + N-IgG, S-IgM + S-IgG, N-IgM + S-IgM, N-IgG + S-IgG, N-IgM + S-IgM + N-IgG + S-IgG in 27 non-ICU patients.
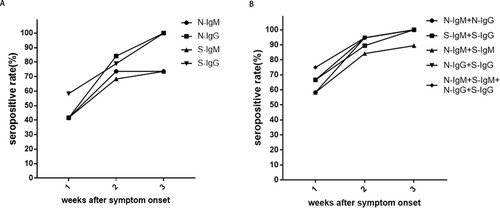
Table 2. Seropositive rate (%).
Figure 2. Kinetics of N and S specific IgM and IgG responses in non-ICU patients and ICU patients. (A) N-IgM, (B) N-IgG, (C) S-IgM, (D) S-IgG responses in 7 non-ICU patients; (E) N-IgM, (F) N-IgG, (G) S-IgM, (H) S-IgG antibodies response in 11 ICU patients.
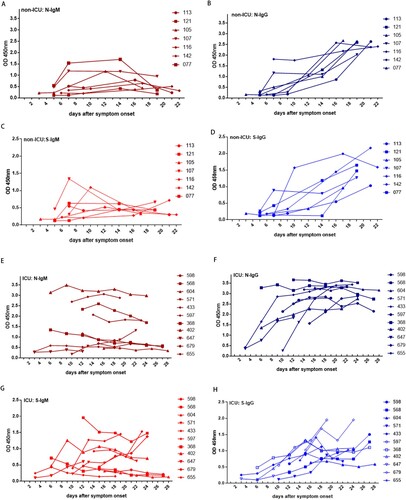
Table 3. SARS-COV-2 N and S specific IgM and IgG responses (OD450nm: mean + SD).
Figure 3. The correlation between N and S specific IgM and IgG responses in non-ICU patients and ICU patients. A. The correlation between S-IgG and S-IgM in non-ICU patients; B. The correlation between N-IgG and N-IgM in non-ICU patients; C. The correlation between S-IgG and S-IgM in ICU patients; D. The correlation between N-IgG and N-IgM in ICU patients. The Pearson correlation coefficient was used to measure the strength of the correlation between IgM and IgG antibodies. The correlation coefficient was calculated using Student’s t-test, a P-value < 0.05 was considered statistically significant. *, P < 0.05; **, P < 0.01; ***, P < 0.001.
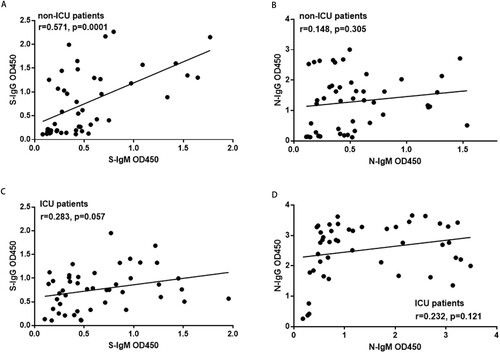
Figure 4. The correlation between N and S specific IgM and IgG responses with CRP in non-ICU patients. A. The correlation between N-IgG and the reduction of CRP; B. The correlation between S-IgG and the reduction of CRP; C. The correlation between N-IgM and CRP; D. The correlation between S-IgM and CRP. The Pearson correlation coefficient was used to measure the strength of the correlation between CPR and IgM or IgG antibodies.
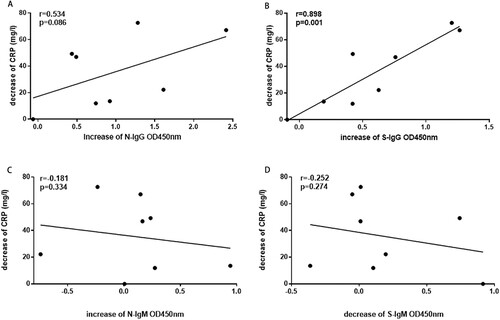
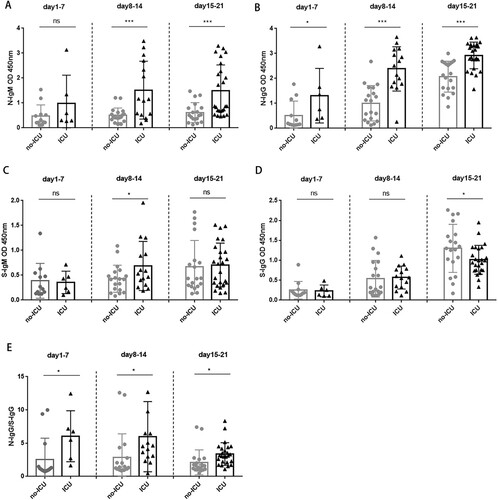
Figure 5. The N and S specific IgM and IgG responses in non-ICU patients and ICU patients. A. Comparison of N-IgM responses between non-ICU and ICU patients; B. Comparison of N-IgG responses between non-ICU and ICU patients; C. Comparison of S-IgM responses between non-ICU and ICU patients; D. Comparison of S-IgG responses between non-ICU and ICU patients. E. Comparison of N-IgG/S-IgG ratio between non-ICU and ICU patients. Correlation coefficient was calculated using Student’s t test, a P-value < 0.05 was considered statistically significant. *, P < 0.05; **, P < 0.01; ***, P < 0.001.