Figures & data
Figure 1. EHEC sense NO in the gut of infected mice. (A) Schematic representation of the NO-sensing reporter system. The EHEC EDL933 strain carries a RES-flanked marker cassette and a PytfE-tnpR transcriptional fusion. In the presence of NO, PytfE is activated, leading to the expression of TnpR recombinase and excision of the cassette. The strain becomes kanamycin-sensitive and sucrose-resistant. (B) The NO reporter strain was grown for 6 h in LB supplemented with various concentrations of NOR-4. Resolutions (percentage of bacteria that have lost the RES marker cassette) were calculated following bacterial numeration on plates with or without sucrose. Values represent the mean ± standard deviation. (C) Mice, treated or not with the NOS inhibitor L-NAME, were infected with the EHEC NO reporter strain. At the indicated time points, resolutions were calculated from faecal samples. Each dot represents one mouse and curves represent mean values. A two-tailed unpaired t-test was applied to compare both groups. ns: non-significant; *p < .05; **p < .01; ***p < .001.
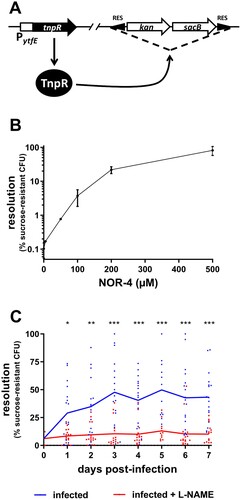
Figure 2. L-NAME treatment of infected mice increases EHEC adhesion to the colonic mucosa. Mice, treated or not with L-NAME, were infected with EDL933 and euthanized at 7 DPI. Caecum and colon were harvested, washed in PBS, crushed and then plated on LB plates with Sm in order to quantify mucosa-associated EHEC. Data are represented as the percentage of adherent bacteria relative to the total number of EHEC quantified in faecal samples. Each dot represents one mouse and means are indicated as a line. A two-tailed unpaired t-test was applied to compare both groups. ns: non-significant; **p < .01.
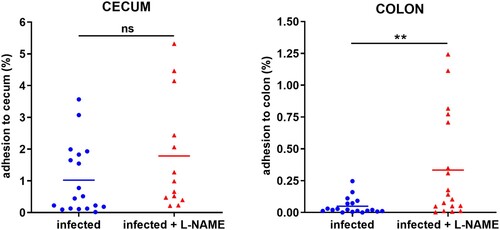
Figure 3. L-NAME treatment of infected mice limits Stx toxicity in the gut. Mice, treated or not with L-NAME, were infected with EDL933. At the indicated time points, Stx activity from faeces was quantified using the Vero-d2EGFP cell line. Each dot represents one mouse and means are indicated as a line. A multiple two-tailed unpaired t-test was applied to compare both groups every day. ns: non-significant; *p < .05; ***p < .001.
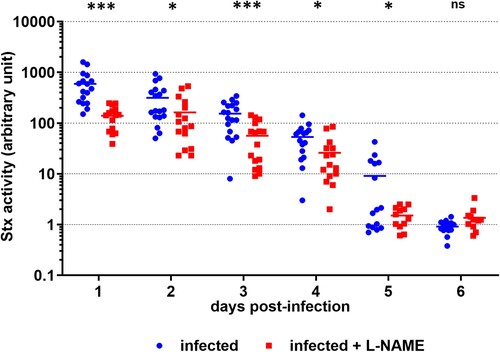
Figure 4. Role of NO in a lethal EHEC infection model. Mice, treated or not with L-NAME, were left uninfected or were infected with EDL933. Each mouse was injected 40 µg of ciprofloxacin (cp) intraperitoneally at 1, 2 and 3 DPI to induce Stx production and release. (A) At the indicated time points, EHEC shedding was quantified by plating faecal samples on LB plates with Sm. Values represent the mean ± standard deviation. (B) Stx activity from faeces was quantified at 2 DPI using Vero-d2EGFP cells. Each dot represents one mouse and means are indicated as a line. Open and closed symbols indicate mice that were dead or alive at 7 DPI, respectively. (C) Mouse weights were recorded every day post-infection and weight curves are presented as the percentage relative to the recorded weight at the day of infection (day 0). Each dot represents one mouse and curves represent mean values. (D) The survival time and rate were recorded for 7 days after infection, and statistic were obtained using a Log-rank (Mantel–Cox) test (n = 20 per group).
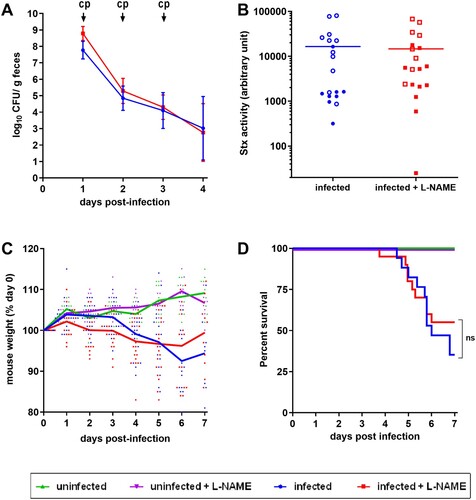
Figure 5. Influence of EHEC infection and L-NAME treatment on the urine specific gravity of mice. Mice, treated or not with L-NAME, were left uninfected or were infected with EDL933 and injections of ciprofloxacin were performed at 1, 2 and 3 DPI. At the indicated time points, urine was collected from each animal and the urine specific gravity was measured using a refractometer. Each dot represents one mouse and curves represent mean values. An ANOVA with the Holm-Sidak test was applied to compare all groups each day. ns: non-significant; *p < .05; ***p < .001.
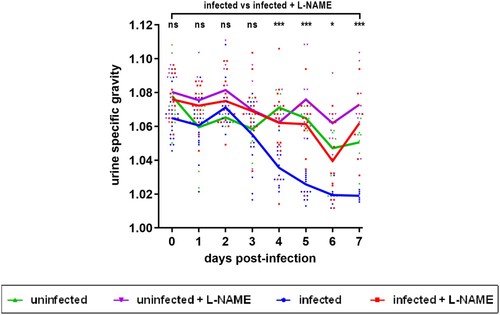
Figure 6. Influence of EHEC infection and L-NAME treatment on kidney structure. Mice, treated or not with L-NAME, were left uninfected or were infected with EDL933. Injections of ciprofloxacin were performed at 1, 2 and 3 DPI and mice were euthanized at 7 DPI. Kidneys were immediately harvested and organ sections were stained with hematoxylin and eosin. Representative images of the kidney of one mouse from each group are shown. Orange arrows show renal corpuscles, which are constituted of a glomerulus surrounded by the Bowman’s capsule.
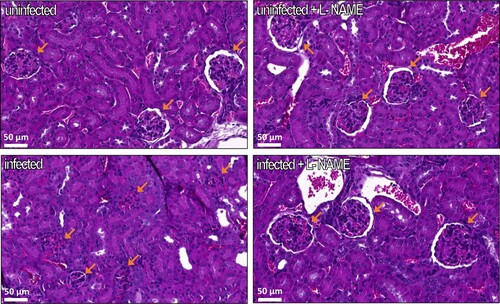
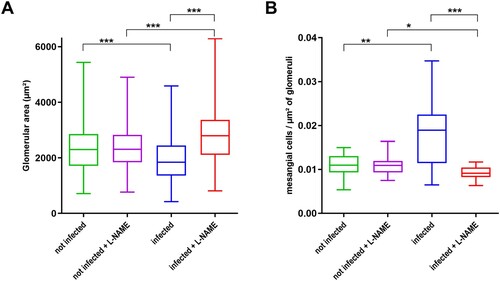
Figure 7. Influence of EHEC infection and L-NAME treatment on the size of glomeruli and concentration of mesangial cells within glomeruli. Mice, treated or not with L-NAME, were left uninfected or were infected with EDL933. Injections of ciprofloxacin were performed at 1, 2 and 3 DPI and mice were euthanized at 7 DPI. Kidneys were immediately sampled and organ sections were stained with hematoxylin and eosin. (A) The surface of each glomerulus observed in a kidney section was quantified from 2 to 4 mice of indicated groups (number of analysed glomeruli > 370 for each group). (B) The concentration of mesangial cells within glomeruli was calculated from 2 to 4 mice of indicated groups. Thirty glomeruli were arbitrarily selected from kidney sections and the number of mesangial cells was divided by surface of the glomerulus. Data are presented as a box and whisker plot. A Kruskal-Wallis test was applied to compare all groups. *p < .05; **p < .01; ***p < .001.