Figures & data
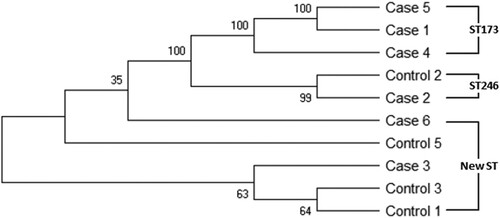
Figure 1. Identification of cytotoxin-producing K. oxytoca from fecal samples of preterm infants. A, Fecal material from the index NEC case was cultured on m-hydroxybenzoate agar; growth was compared to K. pneumoniae and E.coli DH5α. B, Colonies from (A) were cultured on Klebsiella select agar; growth was compared to toxin-negative K. oxytoca (ATCC) and E.coli DH5α. C, Colony PCR for the presence of pehX and npsA/B was performed to further characterize the isolates; toxin-negative K. oxytoca (ATCC) is shown for comparison. Mass spectrometry was performed on bacterial culture supernatants for the detection of tilimycin (D) and tilivalline (E).
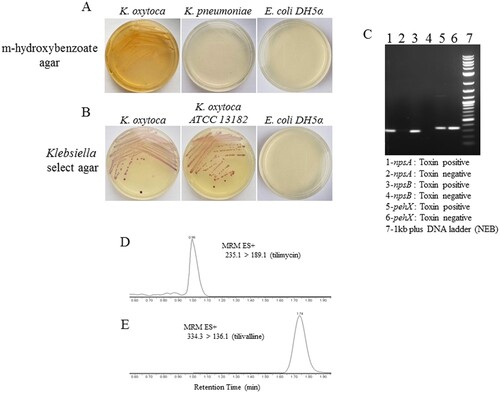
Figure 2. Induction of apoptosis by cytotoxin-producing K. oxytoca. A, Caspase-3 activity was measured in T84 enterocytes following 48 hours of exposure to culture supernatants obtained from toxin-positive or toxin-negative K. oxytoca, or media alone (No Tx). Mean percentages are shown from 3 separate experiments. Analysis was by one-way ANOVA with Tukey’s multiple comparisons test. ***P < 0.001 when compared to No Tx or Toxin-negative. Following 72 hours of exposure as above, T84 enterocytes were visualized by light microscopy (B) or stained with PI and evaluated by flow cytometry (C). Percentages of sub-G1 apoptotic cells are shown.
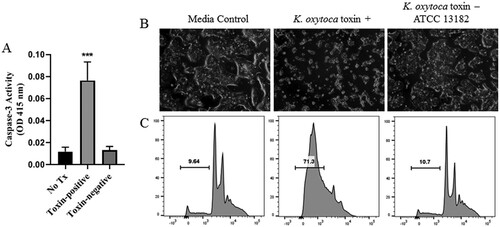
Figure 3. Relative abundance of K. oxytoca OTU in preterm infant fecal samples by 16S rRNA sequencing. A, Mean percentages of rarified reads for the OTU were significantly greater in NEC subjects harbouring toxin-positive strains compared to NEC cases harbouring toxin-negative strains or the non-NEC controls (toxin-positive or toxin-negative). Data represents the composite abundance of K. oxytoca in samples obtained on an approximate weekly basis during the time periods specified in . Analysis was by one-way ANOVA with Tukey’s multiple comparisons test. ***P < 0.0001, **P < 0.01 when compared to Tox+ NEC. B, The abundance of the K. oxytoca OTU in NEC subjects harbouring toxin-positive strains relative to postnatal day of life, onset of NEC, and administration of systemic antibiotics.
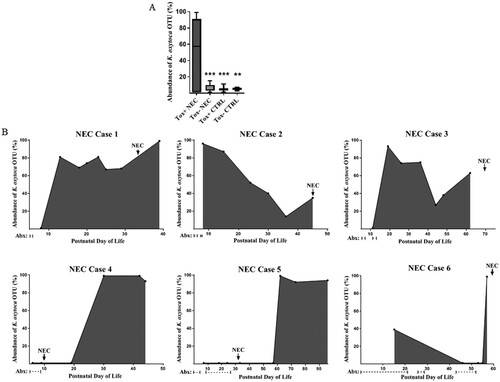
Table 1. Characteristics of study subjects.
Figure 4. MLST phylogenic tree of toxin-positive K. oxytoca isolates obtained from six NEC cases and four non-NEC controls. Phylogenetic tree is constructed based on seven housekeeping genes of K. oxytoca using neighbor-jointing approach. The numbers at the nodes represent bootstrap confidence values based on 1000 replicates. ST numbers are also indicated. New ST: novel sequence type.