Figures & data
Figure 1. Administrative map of Bhutan and districts with documented dengue.
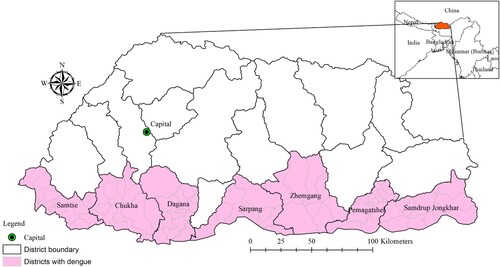
Figure 2. Dengue incidence rates by sub-districts, Bhutan, 2016–2018
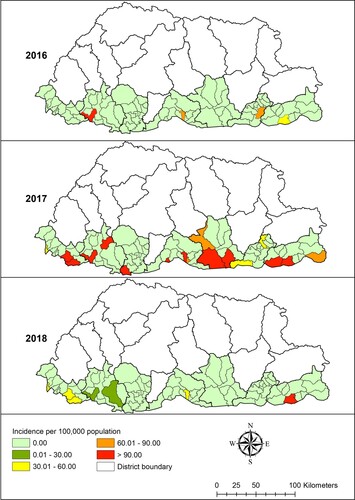
Table 1. Distribution of monthly means of dengue fever cases and climate and environmental variables in Bhutan, January 2016–June 2019.
Figure 3. Raw standardized morbidity ratio of dengue by sub-districts in Bhutan, January 2016–June 2019
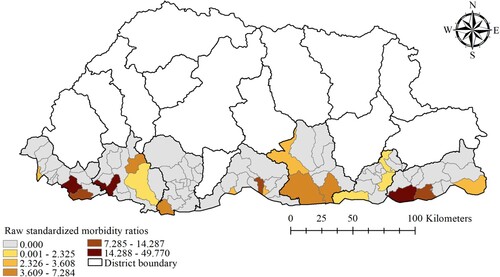
Figure 4. Temporal decomposition of numbers of dengue cases of Bhutan, January 2016–June 2019.
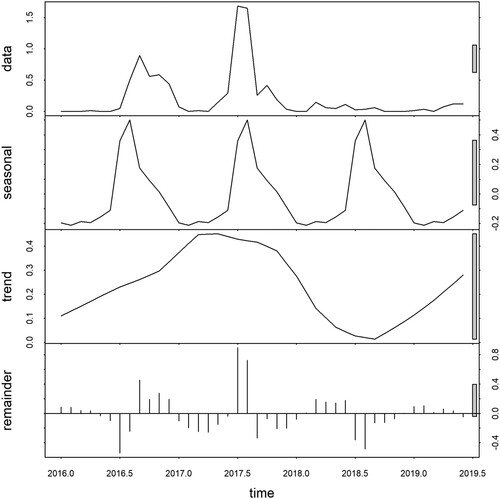
Figure 5. Spatial distribution of posterior means of structured (a) and unstructured random effects (b) in Bhutan, January 2016–June 2019 based on a Bayesian spatiotemporal model.
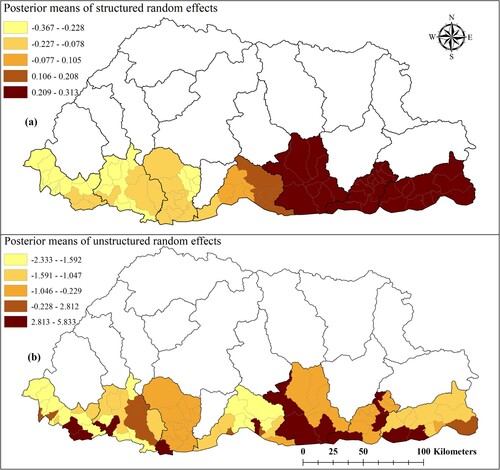
Table 2. Regression coefficients, relative risk and 95% credible interval from Bayesian spatial and non-spatial models of dengue cases in Bhutan, January 2016-June 2019.
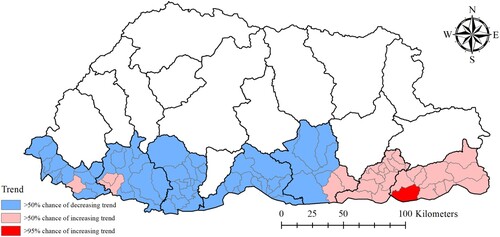
Figure 6. Trend analysis of dengue incidence in Bhutan, January 2016–June 2019, based on the spatiotemporal random effects of a Bayesian model.