Figures & data
Table 1. Univariate and multivariate logistic regression predictors of CDI among studied patients.
Figure 1. Frequency of PCR ribotypes of 366 C. difficile isolates during the study period in Tehran. (A) Most commonly identified C. difficile PCR ribotypes. (B) Other C. difficile PCR ribotypes; ribotypes found at a frequency of less than 10 isolates in a year were grouped into the others category.
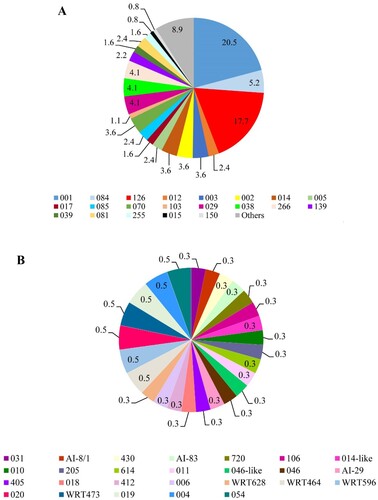
Figure 2. Distribution of C. difficile ribotypes during the study period (2004–2018). Each CE-ribotyping profile is represented by a different colour.
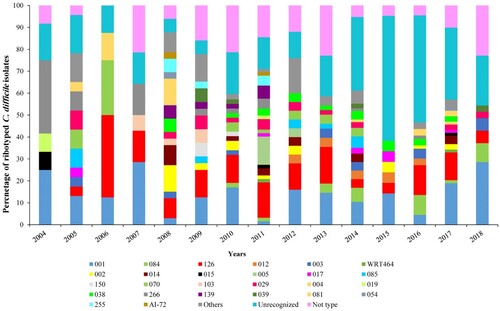
Figure 3. Distribution of C. difficile ribotypes according to patient age groups. (A) Distribution of PCR ribotypes of C. difficile isolates in children (<2–18 years). (B) Distribution of PCR ribotypes of C. difficile isolates in adults (19–64 years). (C) Distribution of PCR ribotypes of C. difficile isolates in elderly (65 to ≥85 years).
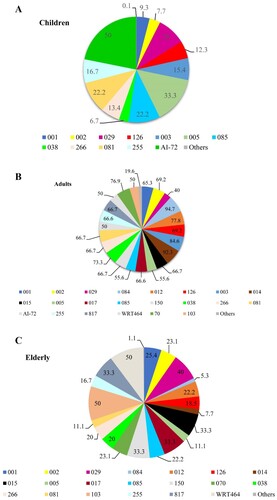
Table 2. Distribution of frequently found C. difficile RTs in HA-CDI and CA-CDI in inpatients and outpatients enrolled in this study.
Figure 4. Geographical distribution of C. difficile PCR ribotypes across different districts of Tehran. Pie charts represent the proportion of PCR ribotypes per 7 districts (D1–D4, D6, D7 and D11) of Tehran. The text on the map and in the centre of pie charts indicates the district number of typed isolates in Tehran. The percent of total numbers for the different ribotypes in the study districts are shown on each pie chart.
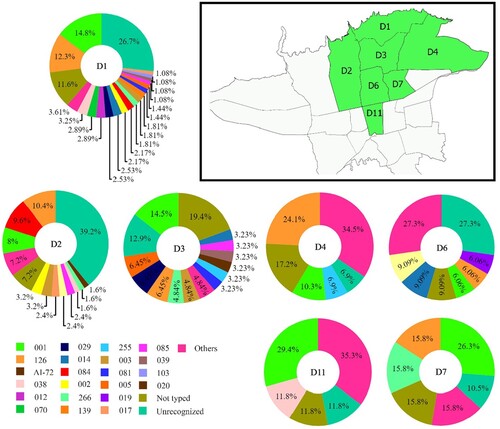
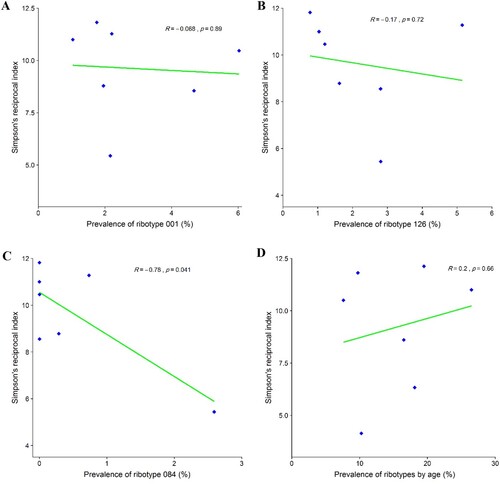
Figure 5. Relationship between prevalence of the most frequently found C. difficile PCR ribotypes in Tehran (RT 001, RT 126 and RT 084) and diversity of other ribotypes using Simpson’s reciprocal index. (A) Simpson’s reciprocal index of diversity for RT 001. (B) Simpson’s reciprocal index of diversity for RT 126. (C) Simpson’s reciprocal index of diversity for RT 084. (D) Simpson’s reciprocal index of RTs diversity with patient age.