
Figures & data
Table 1. Demographic, epidemiologic and clinical characteristics of 788 COVID-19 patients and detailed information on ZJ01 patient.
Figure 1. Existence of potential evolutionary divergence in the SARS-CoV-2 family. (A) The data from a phylogenetic analysis indicated that SARS and SARS-CoV-2 are separate branches, while ZJ01 may be representative of a potential evolutionary subtype of the SARS-CoV-2 family. (B) The RSCU heatmap indicates that eight strains of the SARS-CoV-2 family are closer to human RSCU and differ from other strains. ZJ01 might be a representative of potential branches.
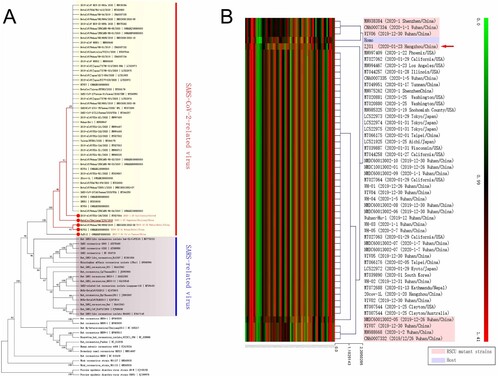
Figure 2. Sequence alignment comparison of ZJ01 mutations with other strains of SARS-CoV-2. (A) The many ZJ01 base mutations are far above average. Some mutations are unique to ZJ01 and appear across every structural domain. Among them, 10 base mutations appear on the S protein, and seven results in amino acid changes. (B) Coronavirus mutations between different species are mainly concentrated in the S1 segment, while the mutations of ZJ01 and other members of SARS-CoV-2 are mainly concentrated in the S2 segment.
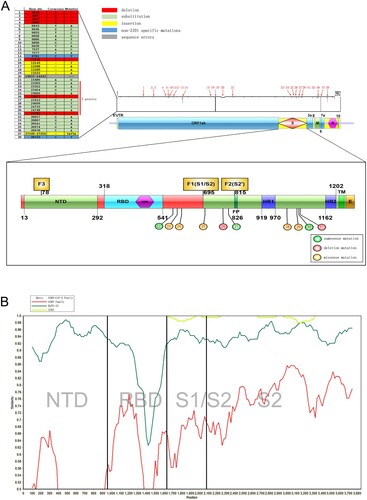
Figure 3. Proposed C/T categorization system for SARS-CoV-2. (A) The SARS-CoV-2 family displayed base mutations in 8824 and 28247 loci with a high (96.3%) correlation. When T appeared in one locus, C would appear in another and vice versa. According to this pattern, we categorized 54 available strains of SARS-CoV-2 into type T (68.5%), type C (27.8%), type TT (1.9%) and type Y (1.9%). (B) BaTG13 and MP789, the possible ancestor of SARS-CoV-2, belong to type T. Therefore, the C/T pattern may appear in the intermediate host or early human transmission stage. (C) Considering global C/T categorization, China, especially the city of Wuhan, presented the C type, while Japan and the United States presented the T type. The difference in the rate of C/T types may help trace the transmission route of SARS-CoV-2.
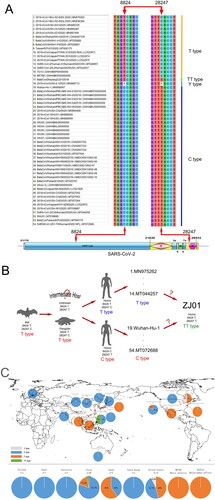
Figure 4. The important role of FCS in SARS-CoV-2 evolution. (A) The number of FCS varied in different coronaviruses. SARS-CoV-2 harboured the F1-3 sites, RaTG13 harboured the F1-2 sites with 96% similarity to SARS-CoV-2, SARS harboured the F2 site, HKU1 and OC43 harboured the F1 site and while HKU9-1 had no FCS. (B) The location and number of FCS may play an important role in coronavirus evolution. (C) The F1 sequence was highly similar among HKU1, OC43 and SARS-CoV-2, perhaps due to translocation of the Furin cleavage site during the evolution of the SARS-CoV-2 ancestor. The result is the ability of human transmission. (D) The extensive conservation of F1-3 in different coronaviruses suggests a potential role in virus invasion and replication.
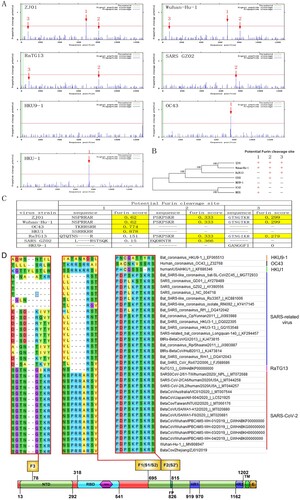
Figure 5. Spatial location and protein structure of potential FCS. (A) The spatial position of F1-3 on S protein. F1 is located at S1/S2, F2 at S2 and F3 at the NTD of S1. (B) Differences in the tertiary structure of the protein at the F1-3 sites of GZ02, RaTG13, Wuhan-Hu-1 and ZJ01. The difference between ZJ01 and Wuhan-Hu-1 may be caused by the mutation of ZJ01 near the FCS.
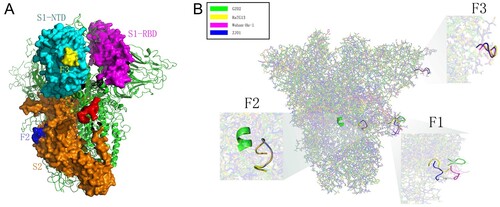
Figure 6. Mutation near the Furin cleavage site may change the surface electrostatic potential of the S protein. Furin has a negative charge, especially in its inner substrate-binding pocket. APBS analysis of the F1-3 sites of GZ02, ZJ01, Wuhan-Hu-1 and RaTG13 revealed a marked difference in electrostatic potential, which may be caused by protein structure changes in F1-3 and nearby loci. Mutation in the F1-2 sites of ZJ01 may alter the binding capacity to Furin, compared with Wuhan-Hu-1.
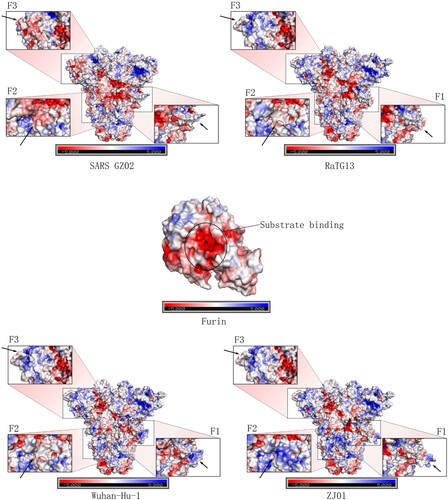
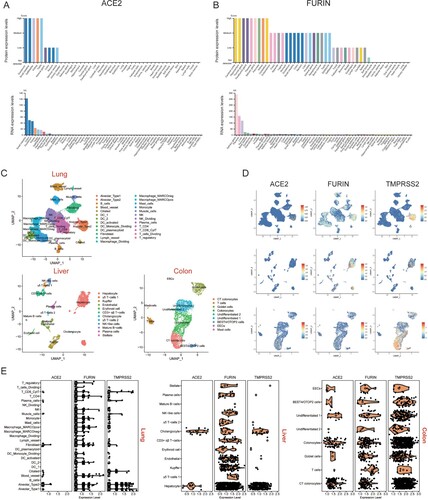
Figure 7. Expression profiles of ACE2 and Furin in multiple human organs. Protein and RNA expression levels of (A) ACE2 and (B) Fusin in major human tissues. NX denotes normalized expression. (C) UMAP plots of cell types in lung, liver and colon scRNA-seq data. Abbreviations are DC, dendritic cells; CT, crypt top; ILCs, innate lymphoid cells; EECs, enteroendocrine cells; BEST4/OTOP2 cells, cells with high expression of BEST4 and OTOP2. (D) UMAP plots indicating the presence of cells that specifically expressed ACE2, Furin and TMPRSS2 in the lung, liver and colon. (E), Violin plots showing ACE2, Furin and TMPRSS2 expression levels in different cell types in lung, liver and colon tissues. Black dots represent the level of gene expression in each cell and white circles represent median values.
Data availability statement
Please see the sequence of ZJ01 in the Appendix of this paper.