Figures & data
Figure 1. Alpha and beta diversity differences between MTB+ and MTB- patients. (A) Alpha diversity was calculated by the observed species, Shannon, Fisher, Simpson, Chao1 and Pielou's evenness indices. Significance was confirmed using the Mann-Whitney U test in GraphPad, Prism 7. (B) Beta diversity of lung bacterial communities in MTB+ and MTB- BALF specimens using unsupervised ordination (NMDS). Centroids are indicated by crosses. NMDS analysis demonstrated significant differences between the MTB+ and MTB- patients (PERMANOVA, R2 = 0.3815, P = 0.007).
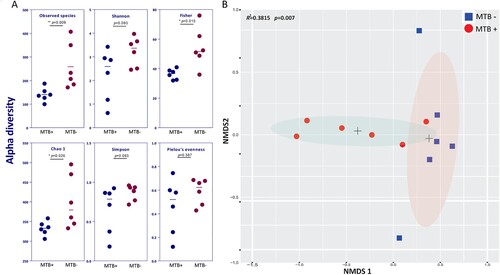
Figure 2. Average relative taxon abundance comparisons between the MTB+ and MTB- groups at the genus level. P-values were determined using the Mann-Whitney U test, and the Benjamini-Hochberg procedure (false discovery rate correction method) was applied to obtain adjusted p values for multiple comparisons between groups. Boxes indicate 5th to 95th percentiles, with median relative abundances marked as lines and whiskers indicating the range (minimum/maximum) multiplied by the interquartile range (5th to 95th percentiles) from the boxes. Bacterial taxa are ranked by average relative abundances of the of overall lung microbiome in MTB- patients.
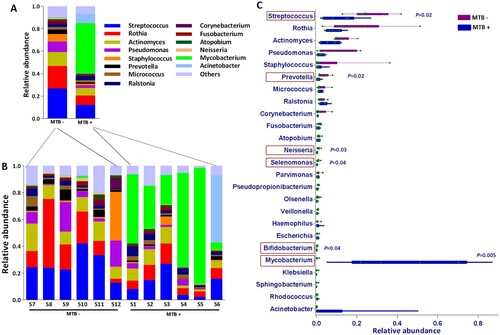
Figure 3. Co-occurring network of microbial communities in lung samples from MTB+ and MTB- patients based on correlation analysis. The connections in the network represent a strong (ρ > 0.6) and significant (P < 0.05) correlations. The nodes are colored by phylum. The size of each node is proportional to the number of connections. The thickness of each edge is proportional to the ρ. Light blue lines represent positive correlations, and purple lines represent negative correlations.
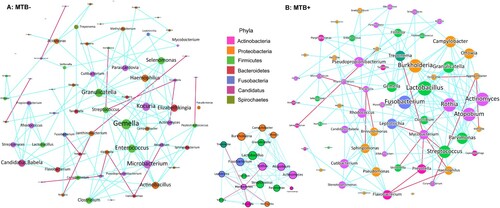
Figure 4. MTB+ and MTB- lung community are functionally distinct. A: a NMDS plot of Bray–Curtis resemblance generated from the square root-transformed KEGG pathway (level 3) relative abundances (generated using HUMAnN2); B: Functional differences between the MTB+ and MTB- patients based on selected metabolic pathways and bacteria associated with such functions through read-mapping; C: network analysis of microbial metabolic profiles in lung samples from MTB+ and MTB- patients based on correlation analysis. The connections in the network represent a strong (ρ > 0.6) and significant (P < 0.05) correlations. The nodes are coloured by KEGG pathway (level 2). The size of each node is proportional to the number of connections. Light blue lines represent positive correlations, and red lines represent negative correlations.
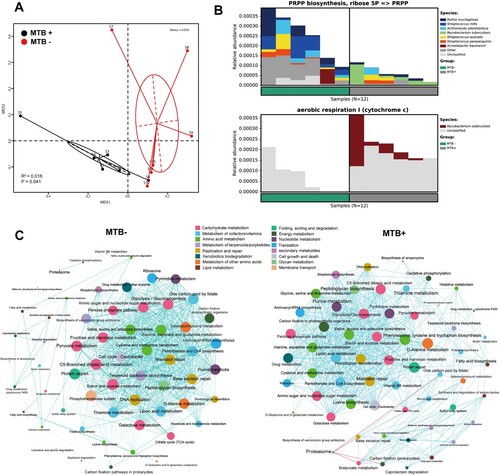
Figure 5. Comparison of microbial composition between the metagenomic and 16S rDNA data. A: Overlap of identified genera between two data sets. B: Comparison of the read abundance of Mycobacteria and M. tuberculosis in lung microbiome from MTB+ and MTB- patients revealed by the metagenomic and 16S rDNA gene amplicon sequencing. C: (1) the top 10 most abundant genera in the metagenomic data in MTB+ data sets; (2) the top 10 most abundant genera in the 16S rDNA data in MTB+ data sets; (3) the top 10 most abundant genera in the metagenomic data in MTB- data sets; (4) the top 10 most abundant genera in the 16S rDNA data in MTB- data sets.
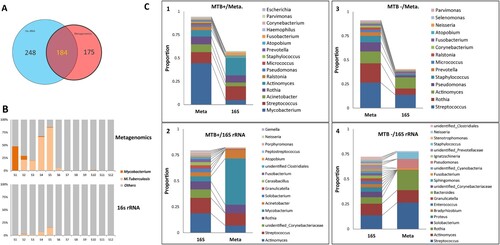
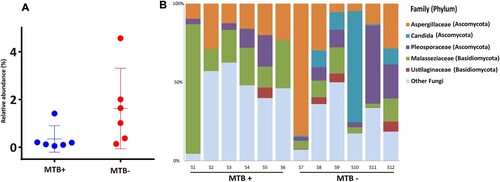
Figure 6. Phylum-level analysis of fungal sequences. A: Comparison of the relative abundance of fungal communities in lung microbiome from the MTB+ and MTB- patients; B: the relative abundance of fungal families in bronchoalveolar lavage fluid from each MTB+ and MTB- patient.